Logging
This guide explains how to collect inference logs during operation and monitor using the MLdebugger SDK.
Overview
The Logging flow is a workflow for collecting real-time inference results in production environments and monitoring model health status in the web app.
The Logger class used in STEP 1 varies by task:
| Task | Logger Class |
|---|---|
| Classification | ClassificationLogger |
| Object Detection | ObjectDetectionLogger |
| 3D Object Detection | ObjectDetection3DLogger |
Prerequisites and Available Features
The available features for Logging vary depending on whether Tracing + Evaluation has been completed.
| Condition | Available Features |
|---|---|
| Tracing + Evaluation Not Completed | Basic metrics only (inference count, statistics, etc.) |
| Tracing + Evaluation Completed | Basic metrics + Error Estimation features (error probability estimation, Issue Category classification) |
Gradual Adoption
You can start with basic monitoring without Tracing + Evaluation, and later run Evaluation to enable Error Estimation features.
STEP 1: Initialize Logger
from ml_debugger.monitoring import ClassificationLogger

logger = ClassificationLogger(
    model,                                      # Production model
    model_name="resnet18",                      # model_name used with Tracer
    version_name="v1",                          # version_name used with Tracer
    result_name="resnet18_v1_classification_v1_20251219",  # result_name of evaluation
)
from ml_debugger.monitoring import ObjectDetectionLogger

logger = ObjectDetectionLogger(
    model,                                      # Object Detection model
    model_name="faster_rcnn",                   # model_name used with Tracer
    version_name="v1",                          # version_name used with Tracer
    result_name="faster_rcnn_v1_od_v1_20251219",  # result_name of evaluation
)
NMS parameters (score_thresh, iou_thresh, max_detections_per_image) can also be optionally specified. Auto-inferred from the model if not specified.
from ml_debugger.monitoring import ObjectDetection3DLogger

logger = ObjectDetection3DLogger(
    model,                                      # 3D Object Detection model
    model_name="centerpoint",                   # model_name used with Tracer
    version_name="v1",                          # version_name used with Tracer
    result_name="centerpoint_v1_od3d_v1_20251219",  # result_name of evaluation
)
NMS parameters (score_thresh, iou_thresh, max_detections_per_frame) can also be optionally specified. Auto-inferred from the model if not specified.
Role of result_name
By specifying result_name, the Logger can estimate error probability and Issue Category based on evaluation results (Error Estimation features).
If not specified, only basic metrics such as inference count and latency are collected.
result_name is optional — you can start without it and enable Error Estimation later by running Tracing + Evaluation.
STEP 2: Collect Inference Logs
Collect logs during inference in the production environment.
import torch

for image in production_dataloader:
    image = image.to(device)

    # Run inference through Logger
    predictions = logger(image)

    # Use inference results (continue normal processing)
    process_predictions(predictions)
Same Usage as Normal Inference
Since Logger wraps the model, it can be used the same way as normal inference. Logs are automatically collected and sent to the API server internally.
3D Object Detection Input Format
For 3D Object Detection, the input data uses a dict format (points, img, etc.).
See the 3D Object Detection tab in Tracing + Evaluation for details.
STEP 3: Monitoring in Web App
Collected logs can be viewed in the web app at app.adansons.ai.
Operation Steps
-
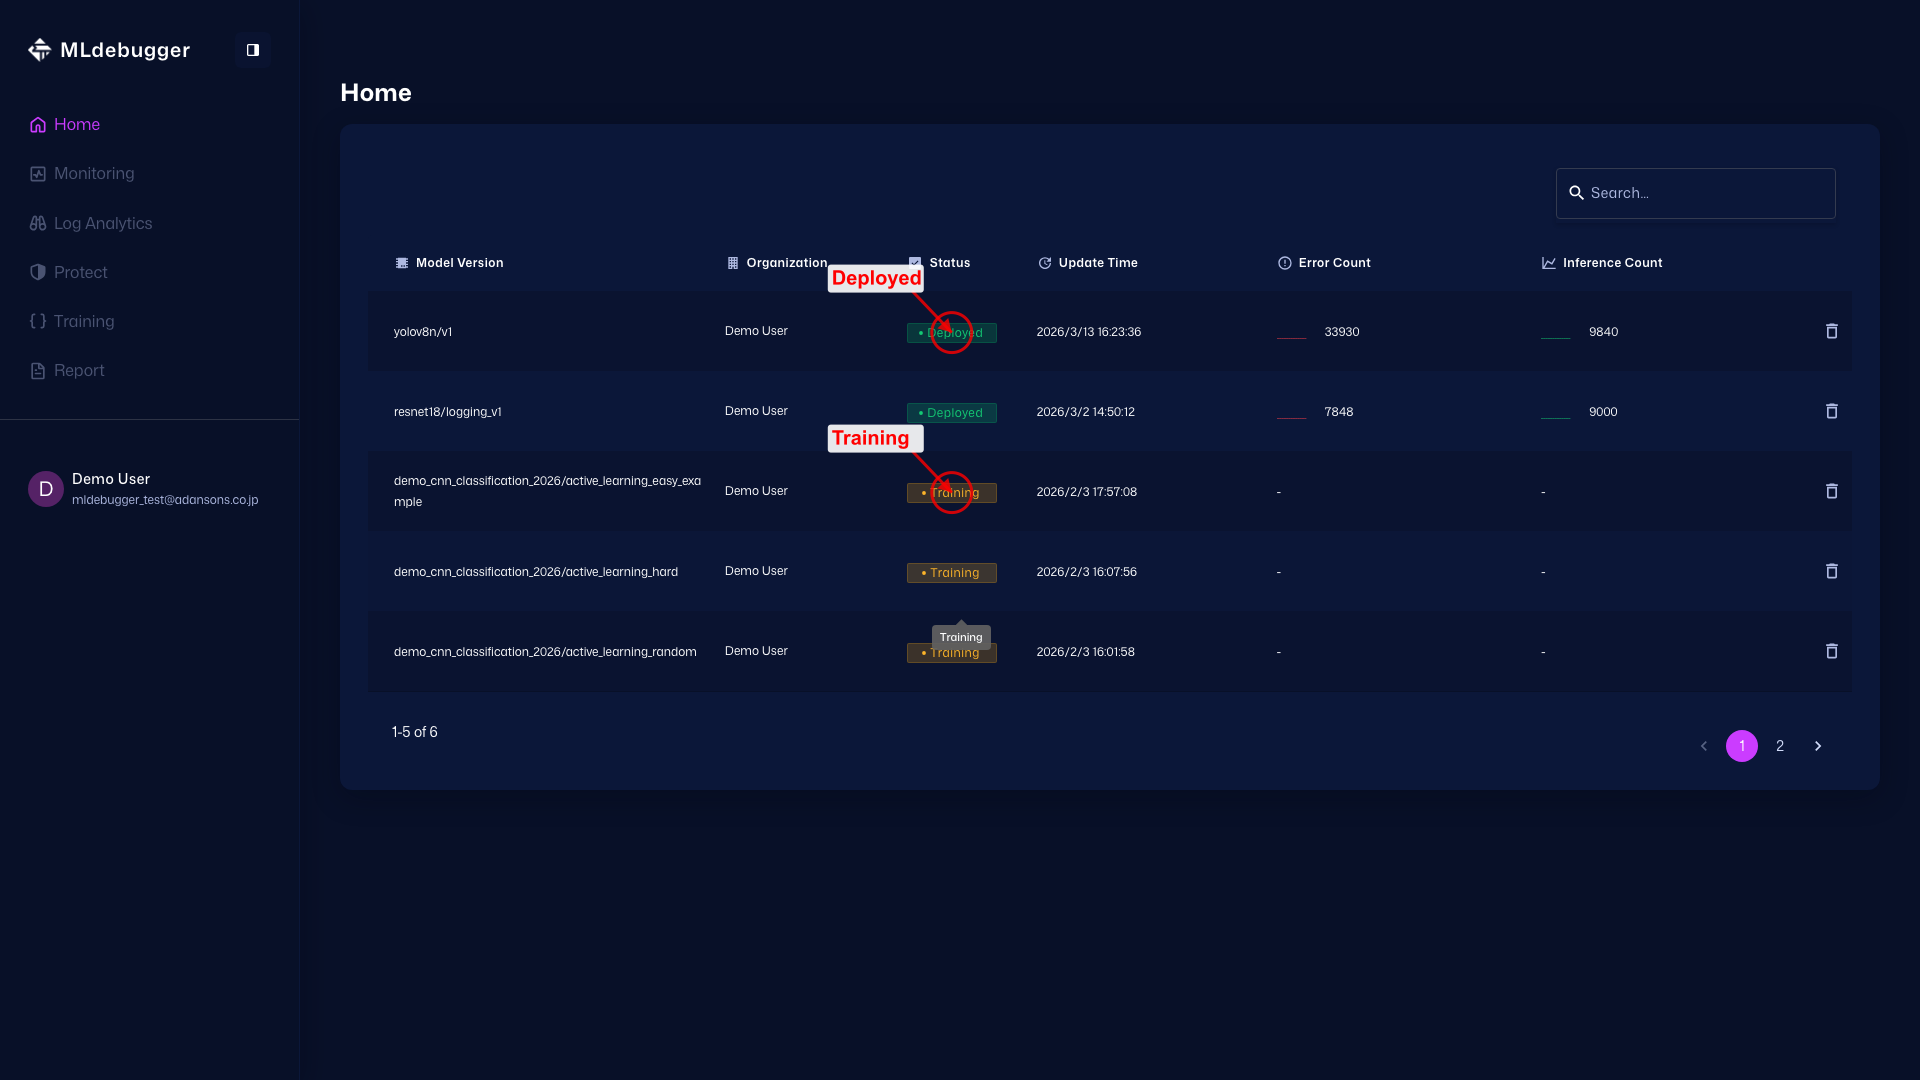
Home Page
URL: https://app.adansons.ai/home
Check model status. Deployed indicates that GT-less operation is active and SDK log collection has started. Training indicates that GT-based evaluation is complete, but GT-less operation log collection has not started yet.
-
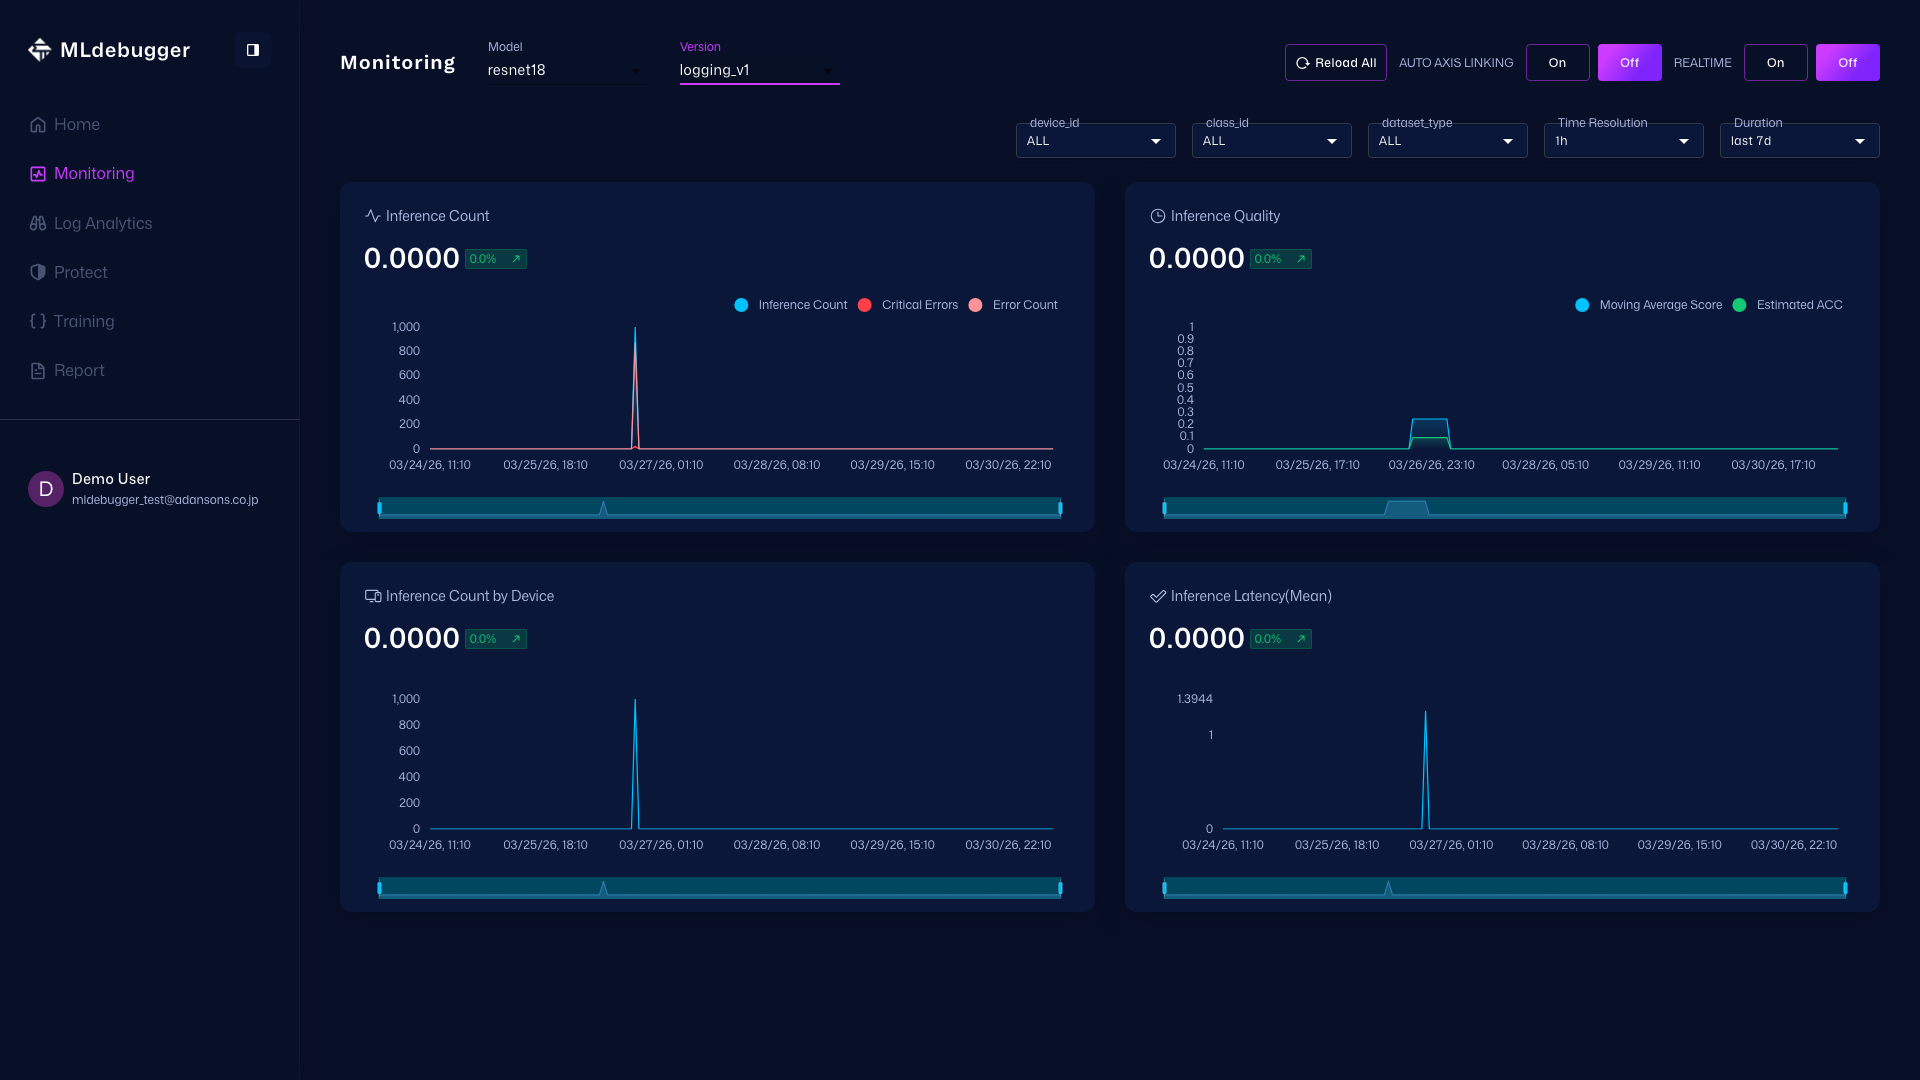
Monitoring Page
URL: https://app.adansons.ai/monitoring
Check changes in inference volume and error trends to understand whether there are signs of anomalies.
-
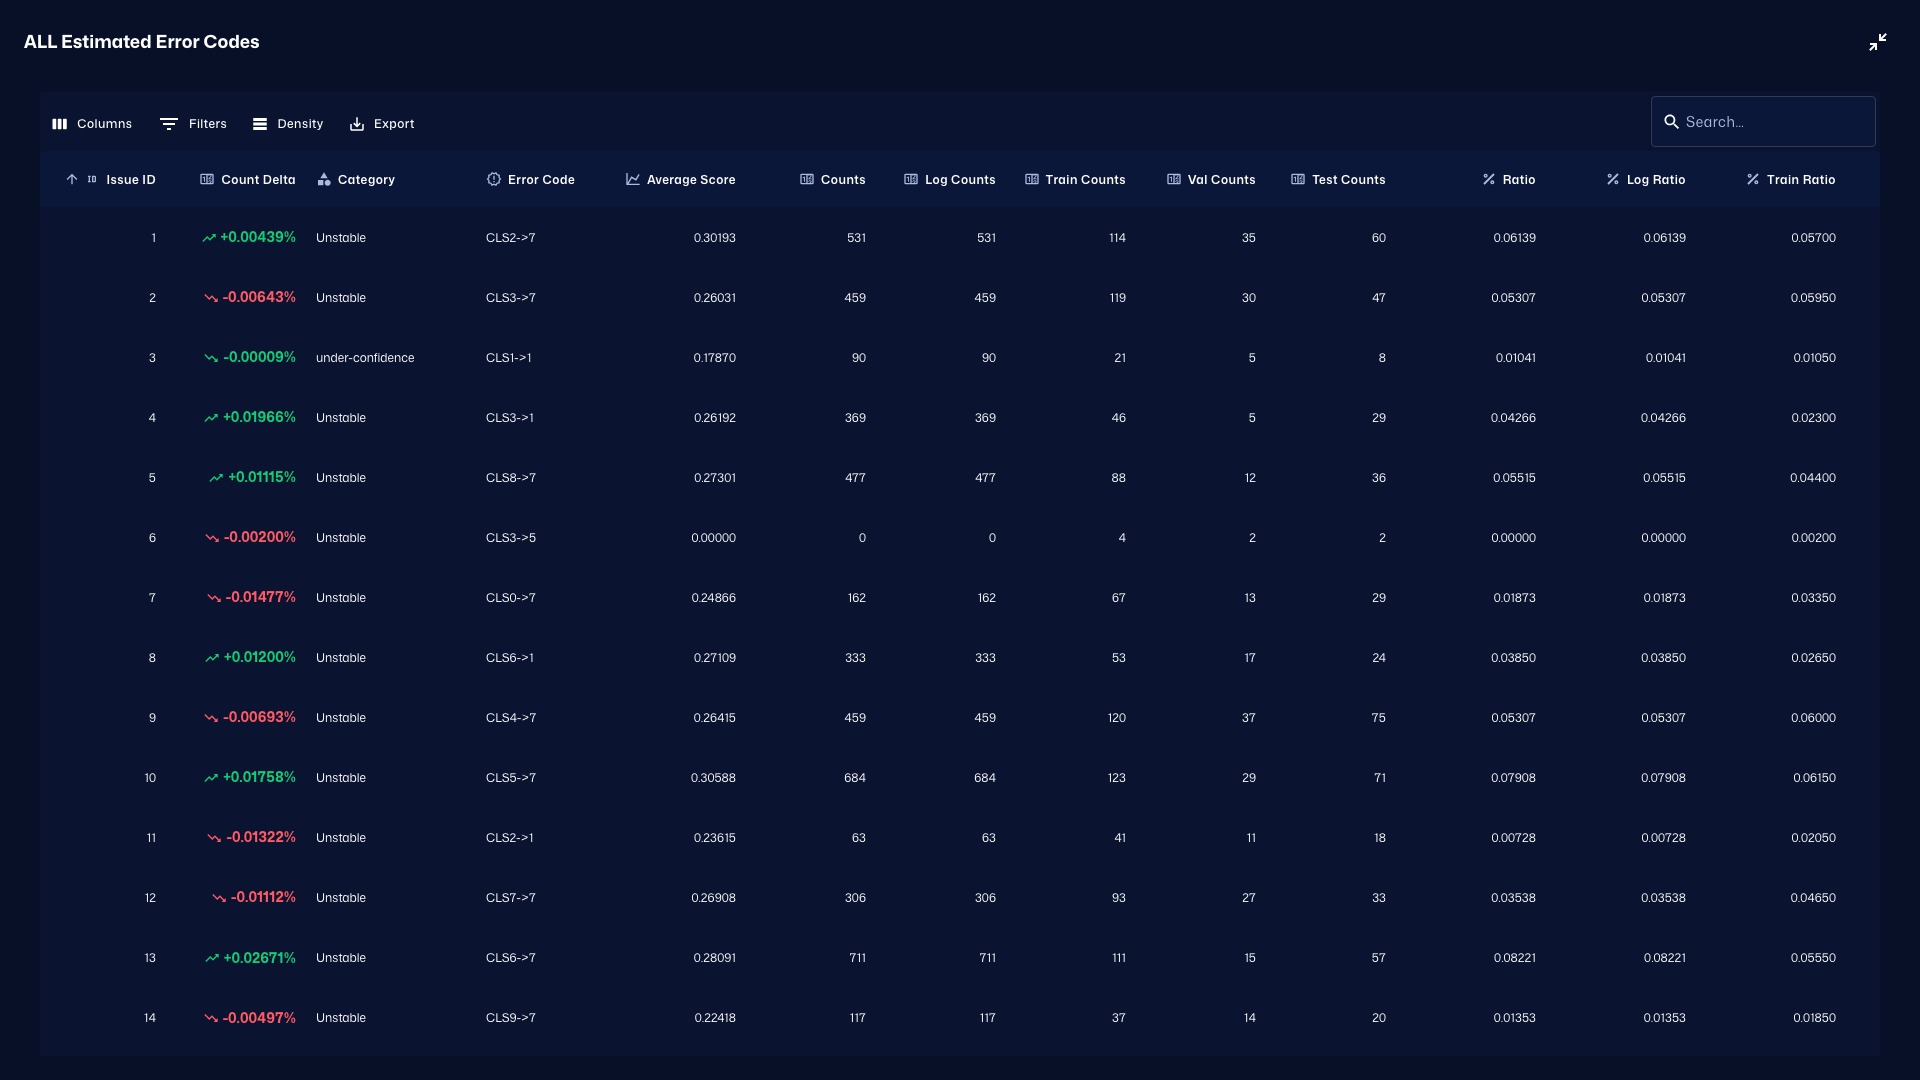
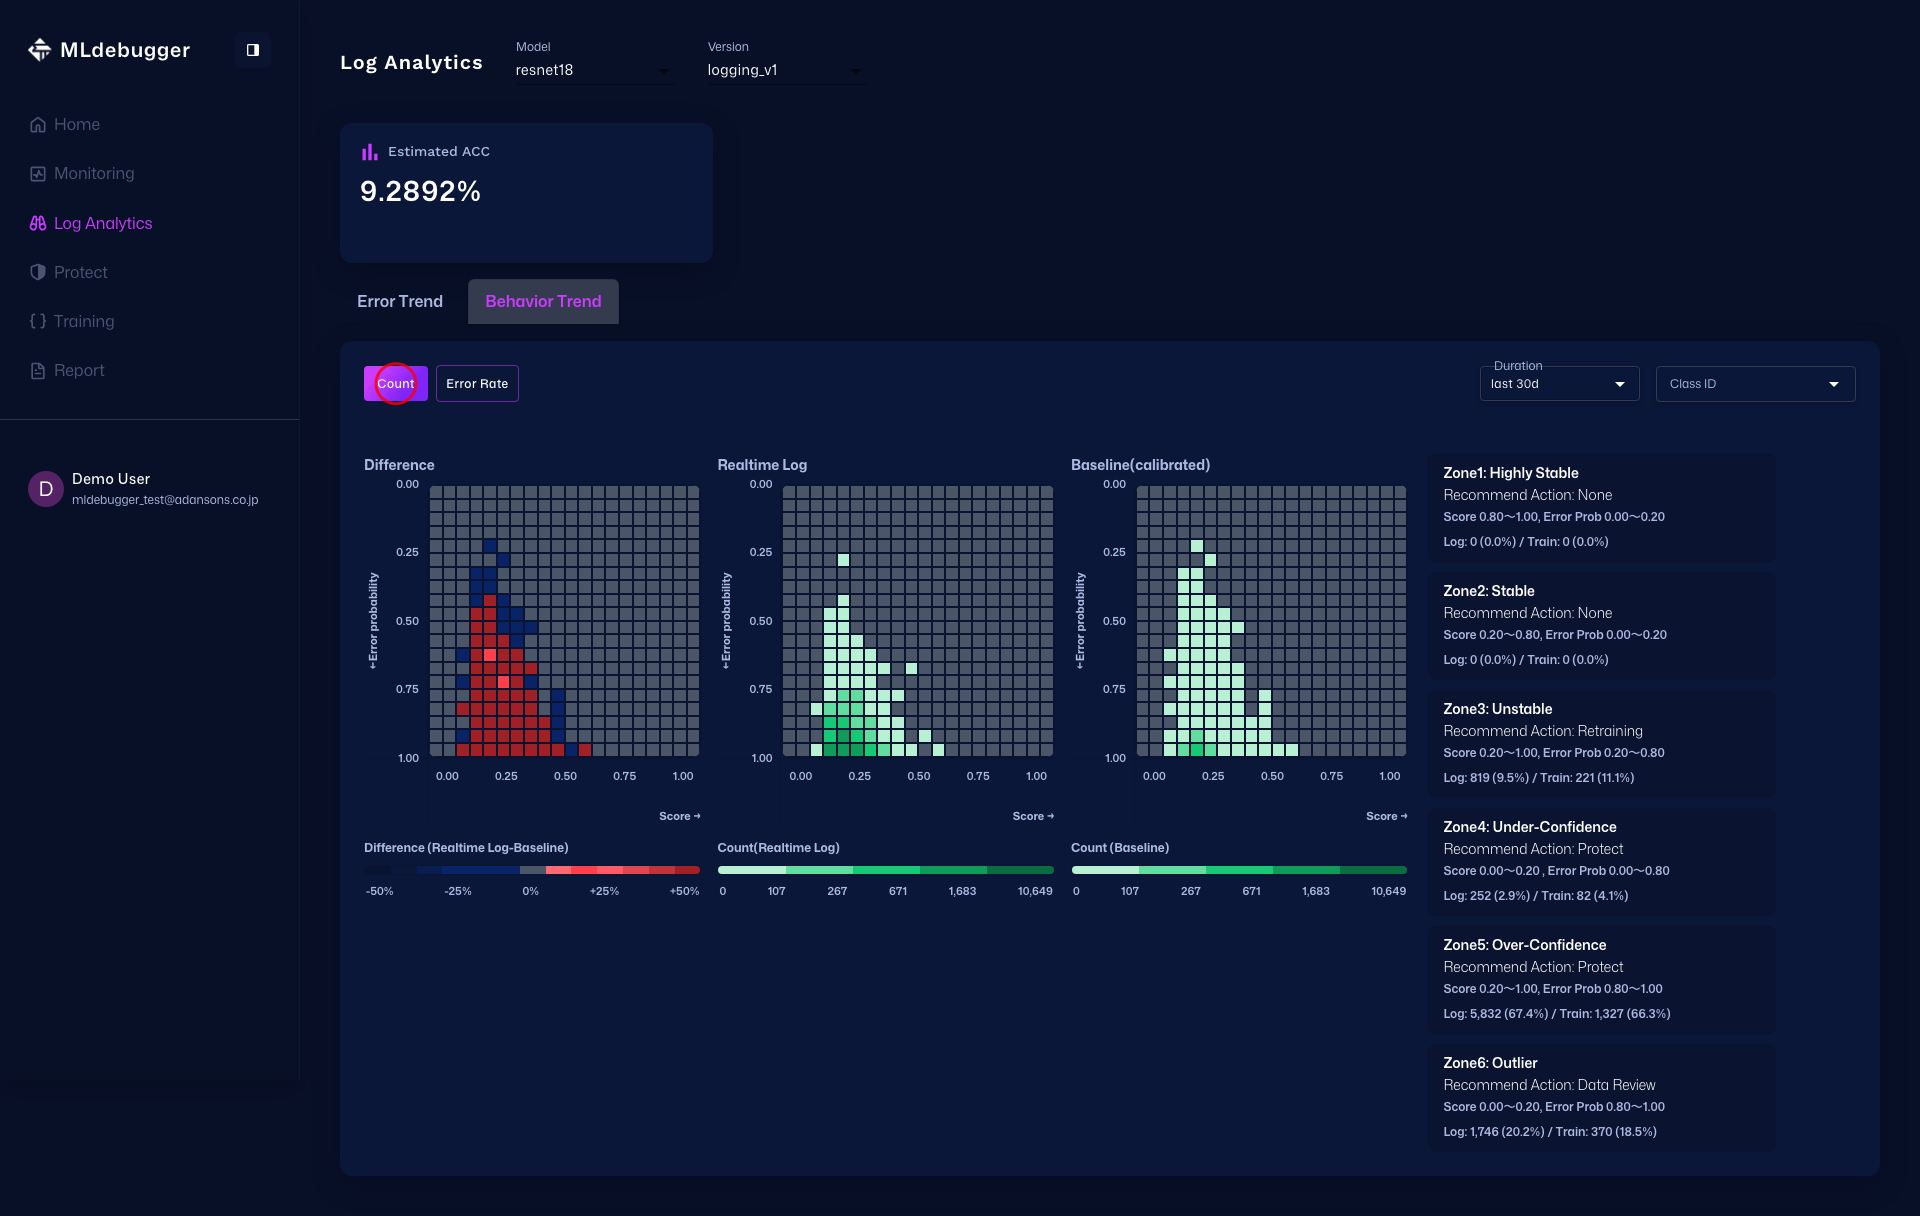
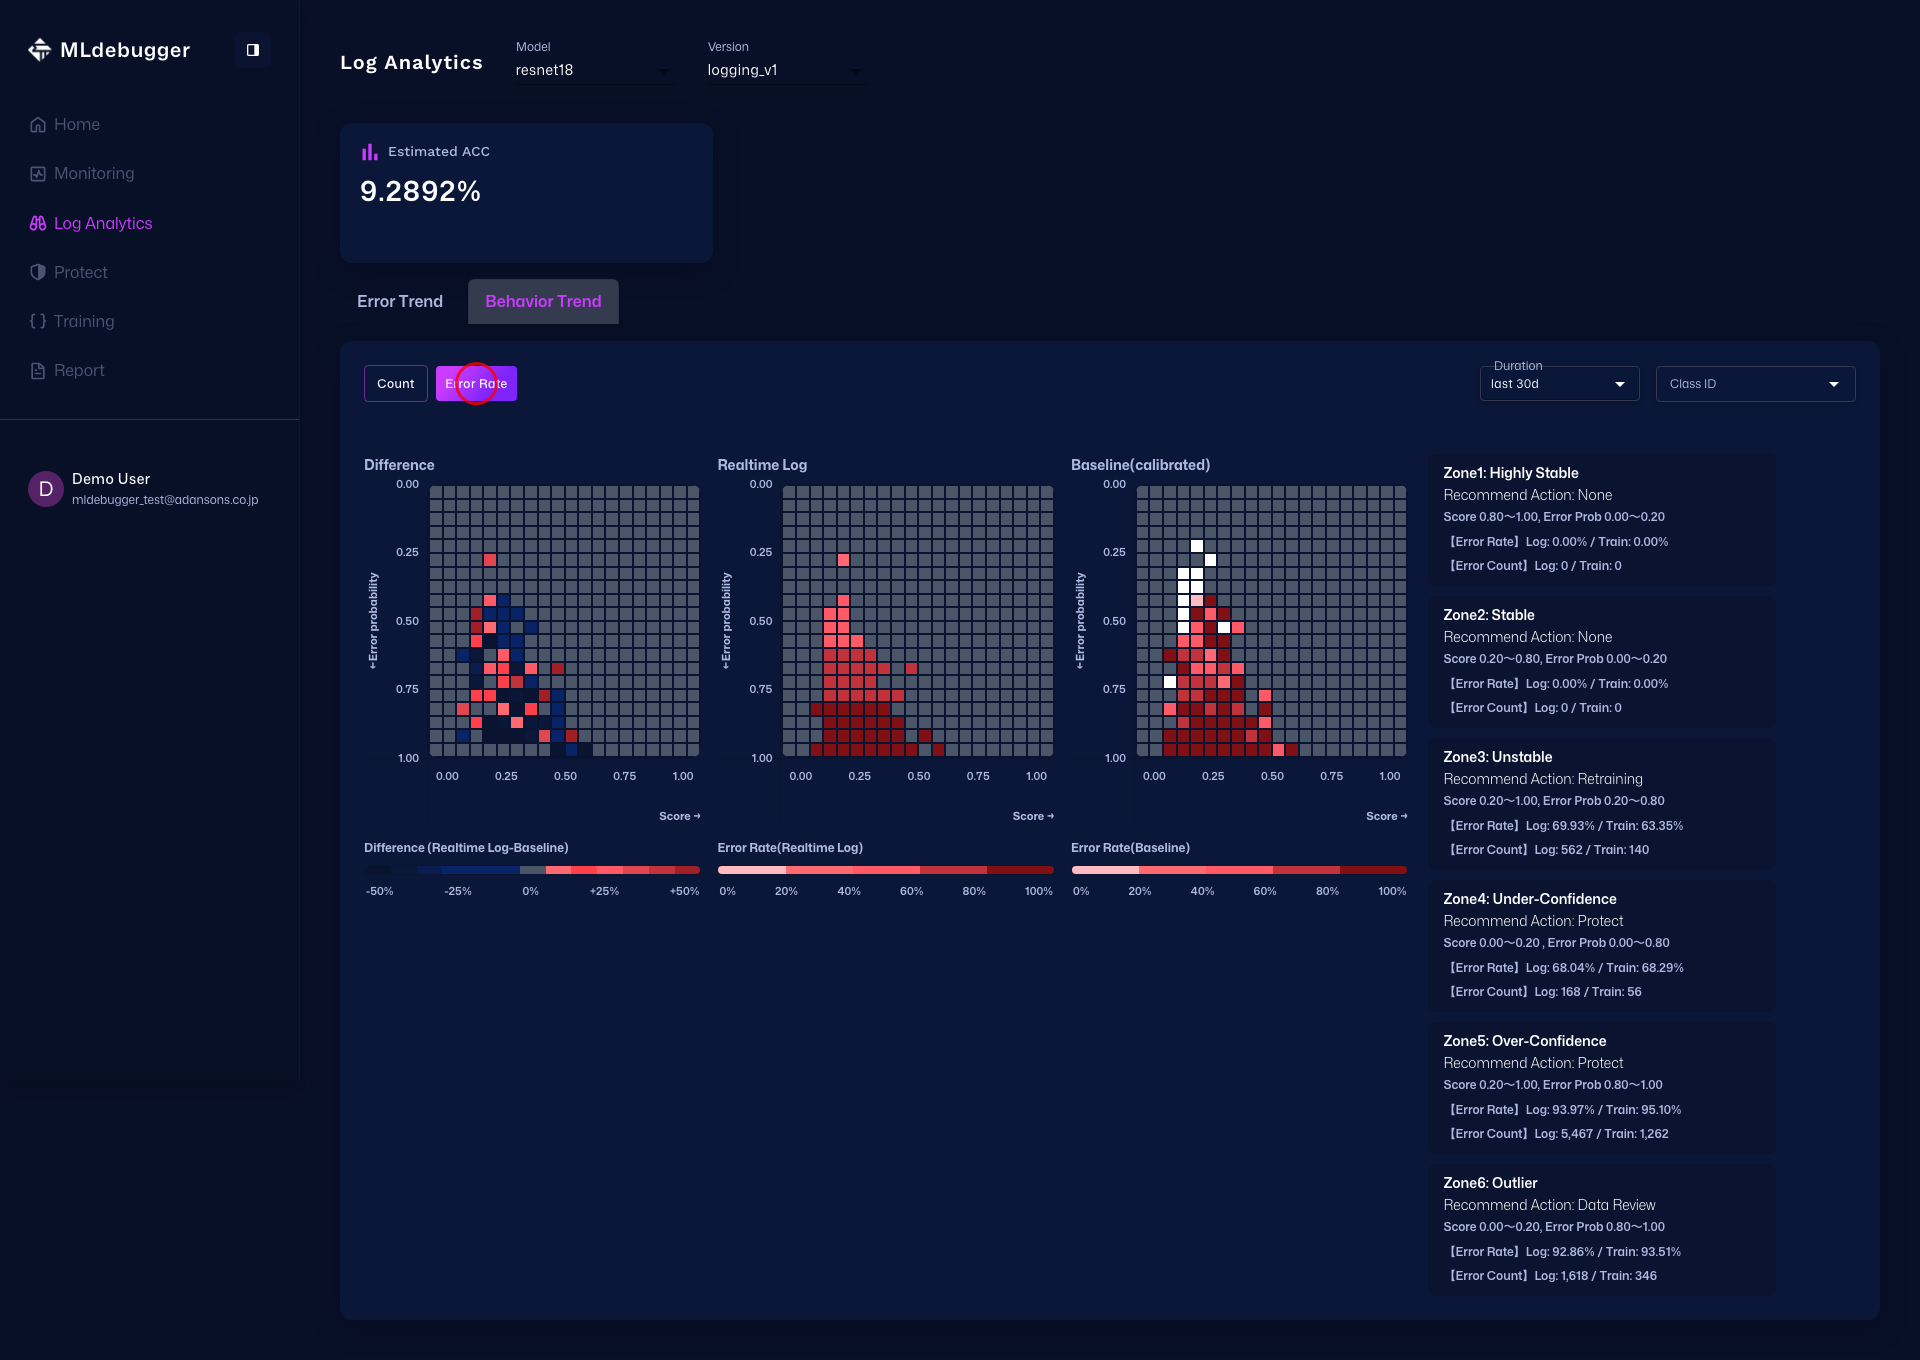
Log Analytics Page
URL: https://app.adansons.ai/log-analytics
Use Error Map to get an overview of trends by error code, expand Issue List to inspect details, and analyze Delta / Count / Error Rate in Heatmap.
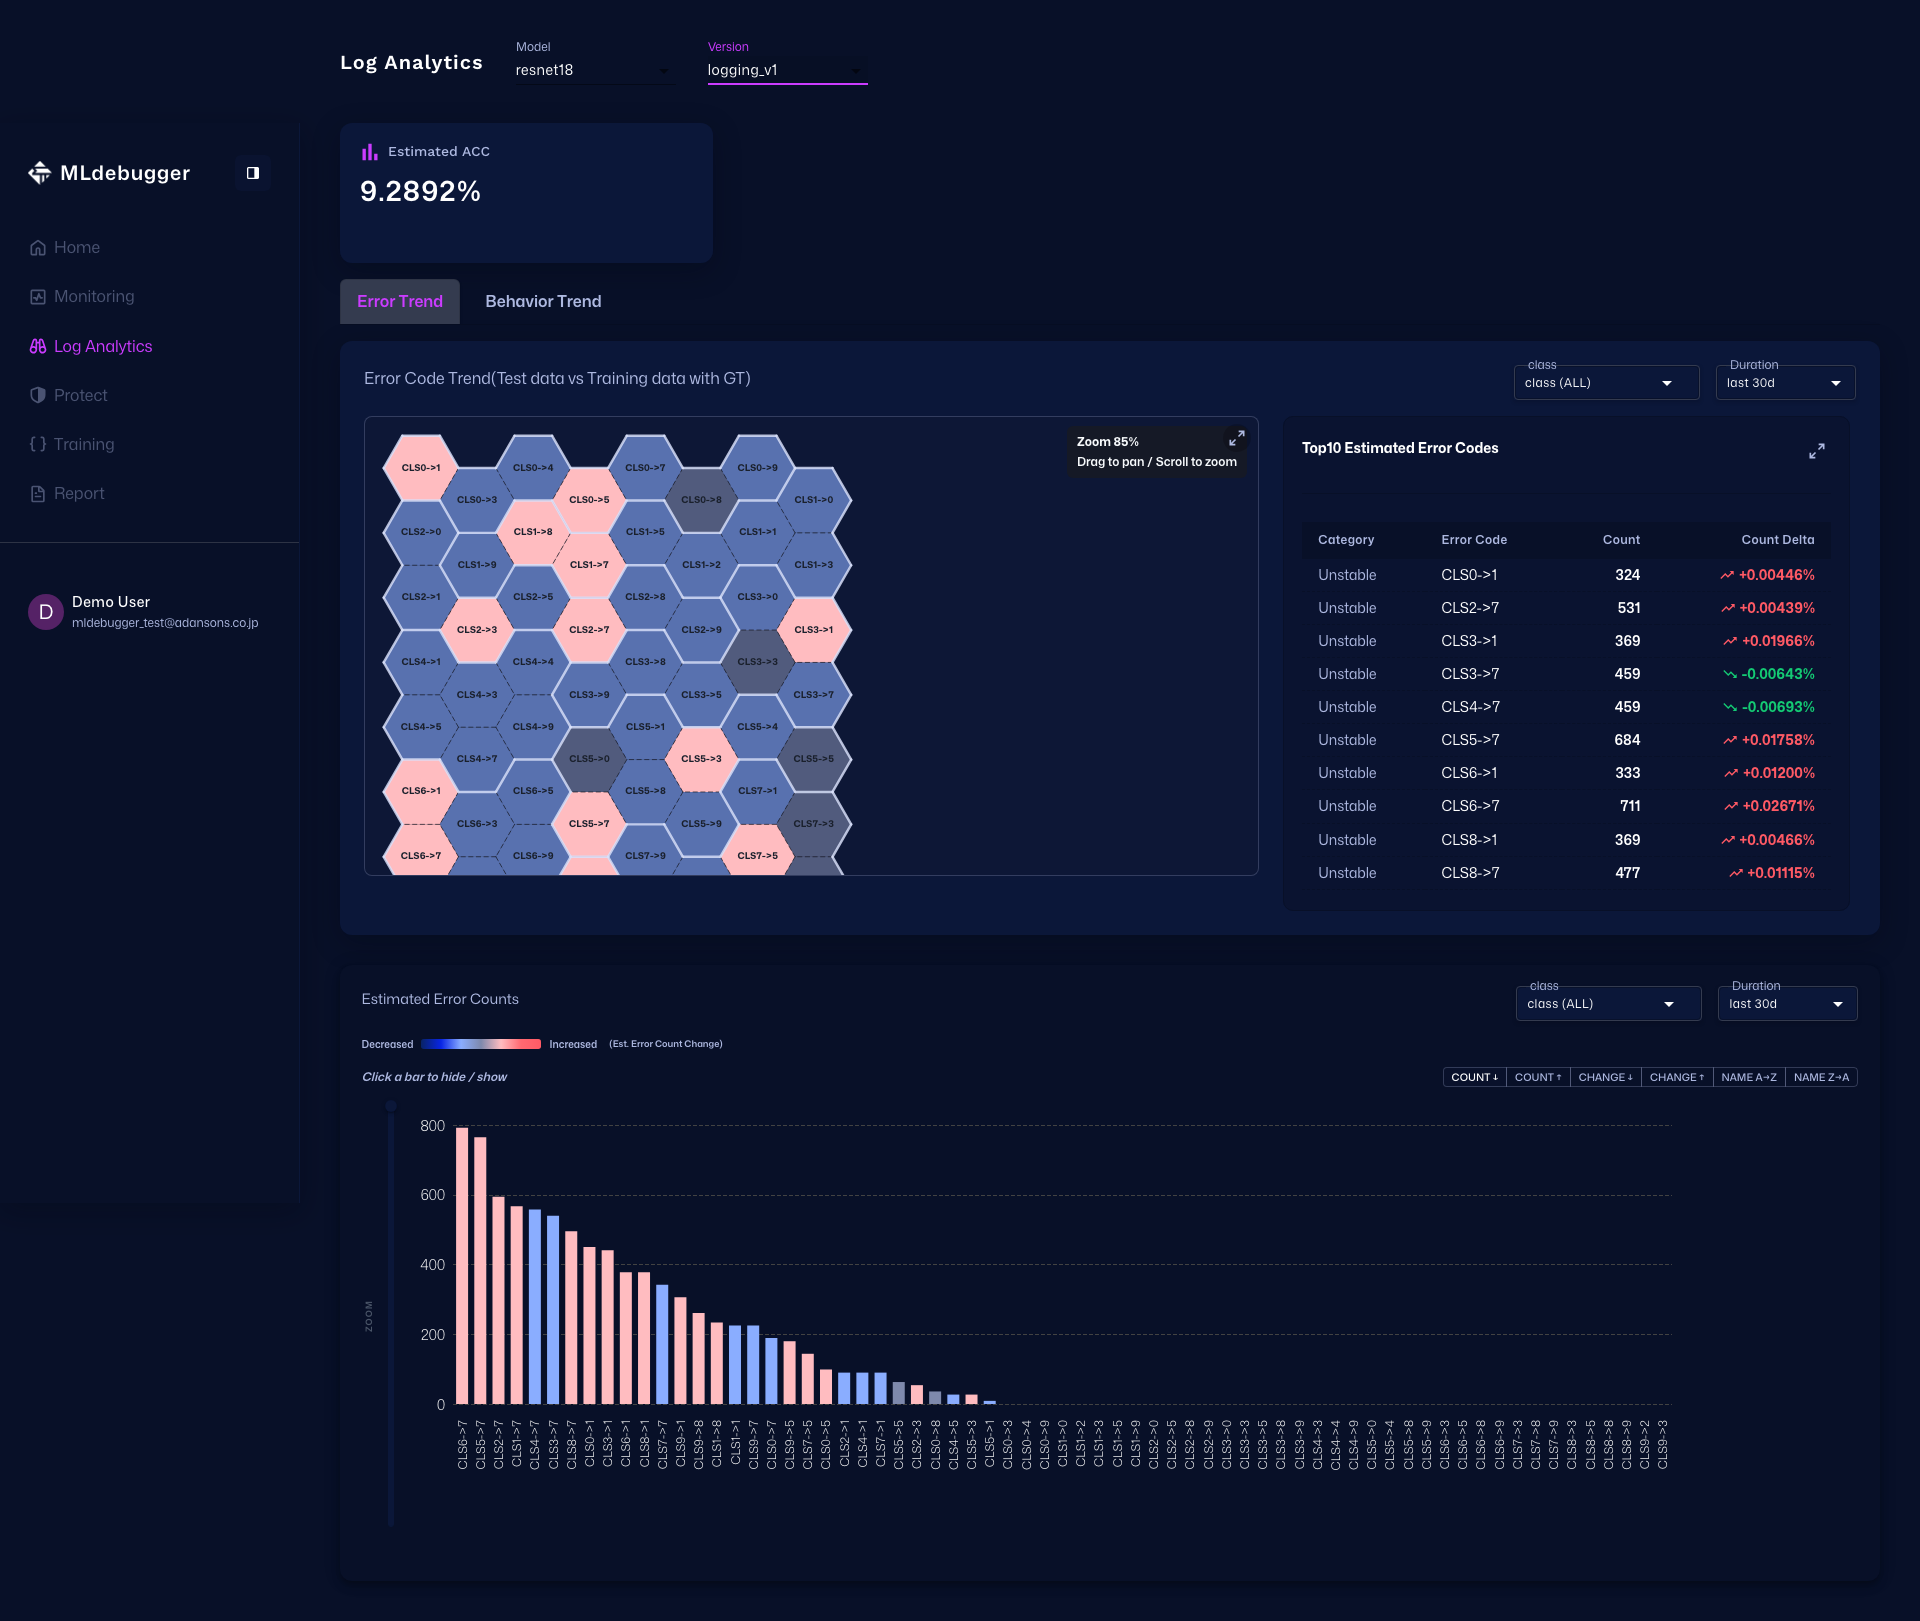
In the Heatmap tab, first use Delta Heatmap to identify areas with strong distribution differences, then use Count Heatmap to review count distribution, and finally use Error Rate Heatmap to identify areas with high error rates.

Information Available in Monitoring
Basic Metrics (always available):
- Inference Count Trends: Number of inference requests by time period
- Statistics: Latency, throughput, etc.
Error Estimation Features (only when result_name is specified):
- Error Probability Distribution: Distribution of error probabilities in inference results
- Issue Category Distribution: Distribution by category such as Hotspot, Coverage
- Alerts: Detection and notification of abnormal patterns
Complete Sample Code
import os
import torch
from ml_debugger.monitoring import ClassificationLogger

# Set authentication credentials
os.environ["MLD_API_ENDPOINT"] = "https://api.adansons.ai"
os.environ["MLD_API_KEY"] = "mldbg_*************"

model = ...  # Production model
device = torch.device("cuda" if torch.cuda.is_available() else "cpu")

model.to(device)
model.eval()

# Initialize Logger
logger = ClassificationLogger(
    model,
    model_name="my_model",
    version_name="v1",
    result_name=result.result_name,
)

# Inference in production
for image in production_dataloader:
    image = image.to(device)
    with torch.no_grad():
        predictions = logger(image)
    process_predictions(predictions)
import os
import torch
from ml_debugger.monitoring import ObjectDetectionLogger

# Set authentication credentials
os.environ["MLD_API_ENDPOINT"] = "https://api.adansons.ai"
os.environ["MLD_API_KEY"] = "mldbg_*************"

model = ...  # Object Detection model
device = torch.device("cuda" if torch.cuda.is_available() else "cpu")

model.to(device)
model.eval()

# Initialize Logger
logger = ObjectDetectionLogger(
    model,
    model_name="my_od_model",
    version_name="v1",
    result_name=result.result_name,
)

# Inference in production
for image in production_dataloader:
    image = image.to(device)
    with torch.no_grad():
        predictions = logger(image)
    process_predictions(predictions)
import os
import torch
from ml_debugger.monitoring import ObjectDetection3DLogger

# Set authentication credentials
os.environ["MLD_API_ENDPOINT"] = "https://api.adansons.ai"
os.environ["MLD_API_KEY"] = "mldbg_*************"

model = ...  # 3D Object Detection model
device = torch.device("cuda" if torch.cuda.is_available() else "cpu")

model.to(device)
model.eval()

# Initialize Logger
logger = ObjectDetection3DLogger(
    model,
    model_name="my_3d_od_model",
    version_name="v1",
    result_name=result.result_name,
)

# Inference in production
for points in production_dataloader:
    points = points.to(device)
    predictions = logger(points)
    process_predictions(predictions)
Difference from DataFilter
| Feature | Logger | DataFilter |
|---|---|---|
| Use Case | Monitoring during operation | Data selection based on error patterns |
| Labels | Not required | Not required |
| Query Function | No | Yes |
| Web App Integration | Yes | No |
Next Steps
- Tracing + Evaluation - Basic workflow
- DataFiltering - Data selection and filtering based on error patterns