Protect (Policy / Blocking Conditions)
URL: https://app.adansons.ai/protect
Screen Overview
Purpose
This screen is used to decide which data conditions should be blocked for GT-less inference while looking at heatmaps.
You determine data blocking conditions while simulating metrics such as Estimated ACC.
Key Features
Use metric cards to check blocking impact, then validate condition behavior with the Heatmap, Zone editing, and Performance Simulation including the Log Scale toggle.
Initial View
This screen lets you create blocking conditions (policies) by selecting segments from the Score / Error Probability distribution. Some areas are available only in demo mode.

Metrics Card List
The Protect metrics cards show the effect of blocking conditions using the four indicators below.
- Estimated ACC: Estimated inference accuracy under the current conditions
- Blocked Data Rate: Ratio of data subject to blocking
- Blocked Estimated Correct Inference Count: Blocked correct inferences / total correct inferences
- Blocked Estimated Incorrect Inference Count: Blocked incorrect inferences / total incorrect inferences
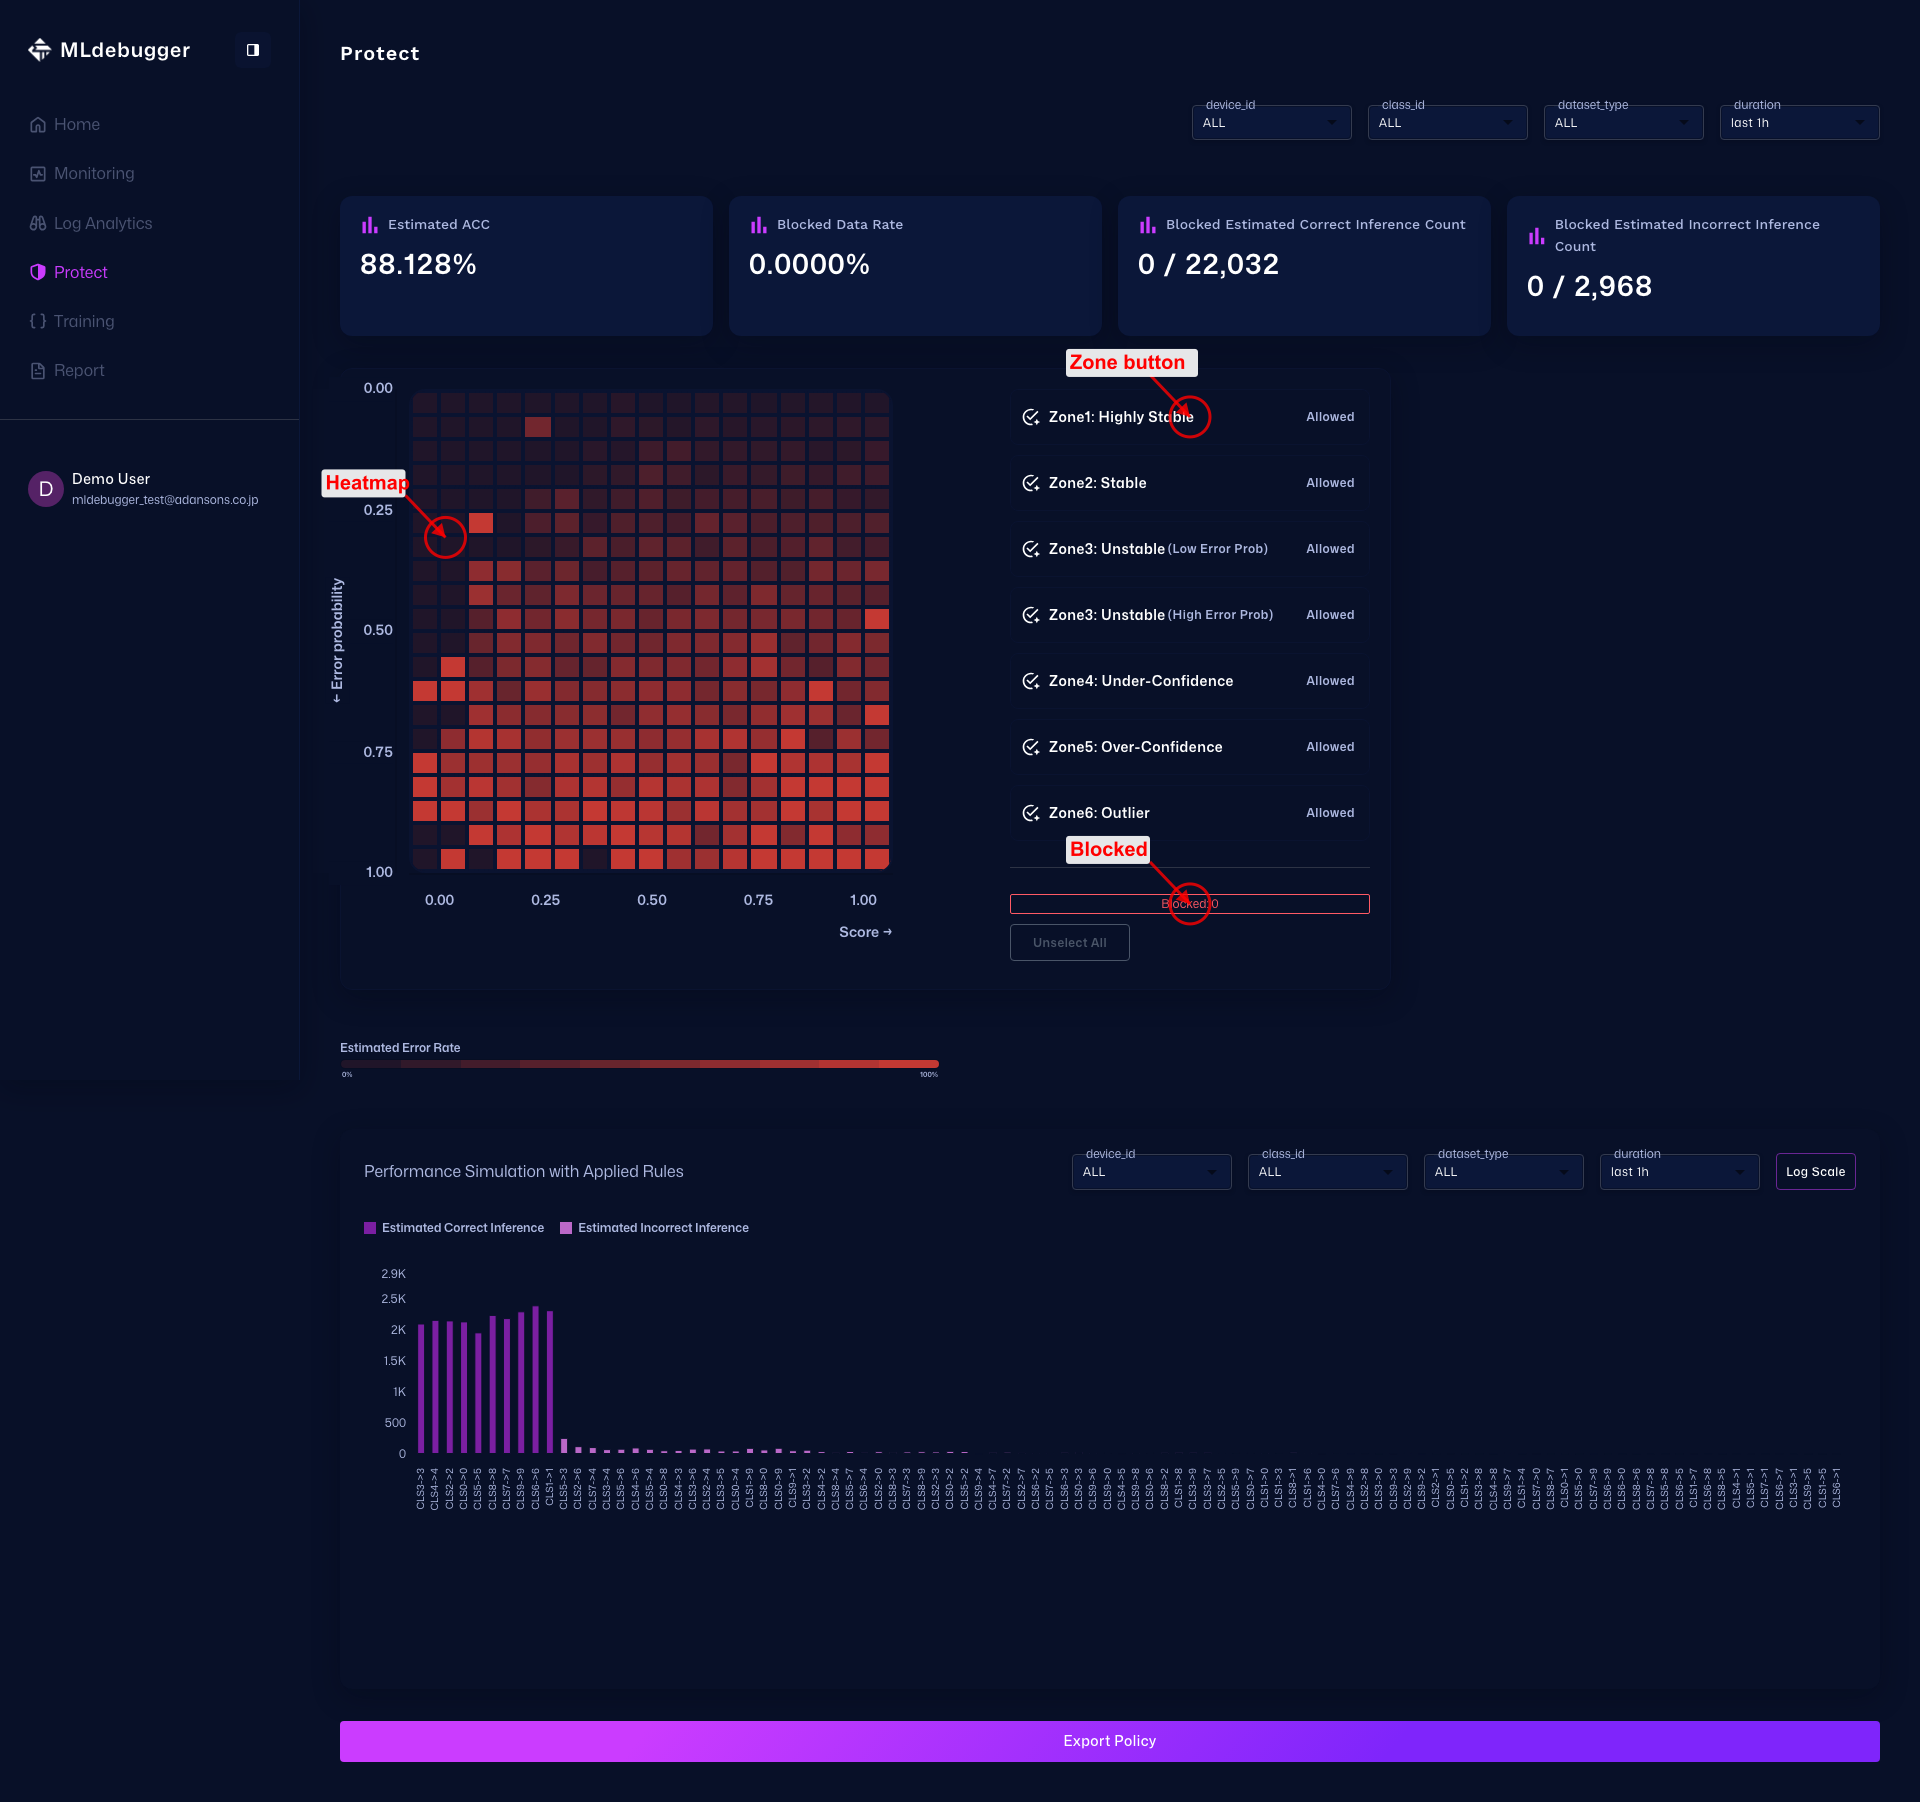
Protect Function Map (Heatmap, Zone, Block Status)
This view shows the relationship among heatmap cell selection, the Zone edit button, and the Blocked count display in one screen. The results of cell selection and Zone editing are reflected in the blocked indicators.
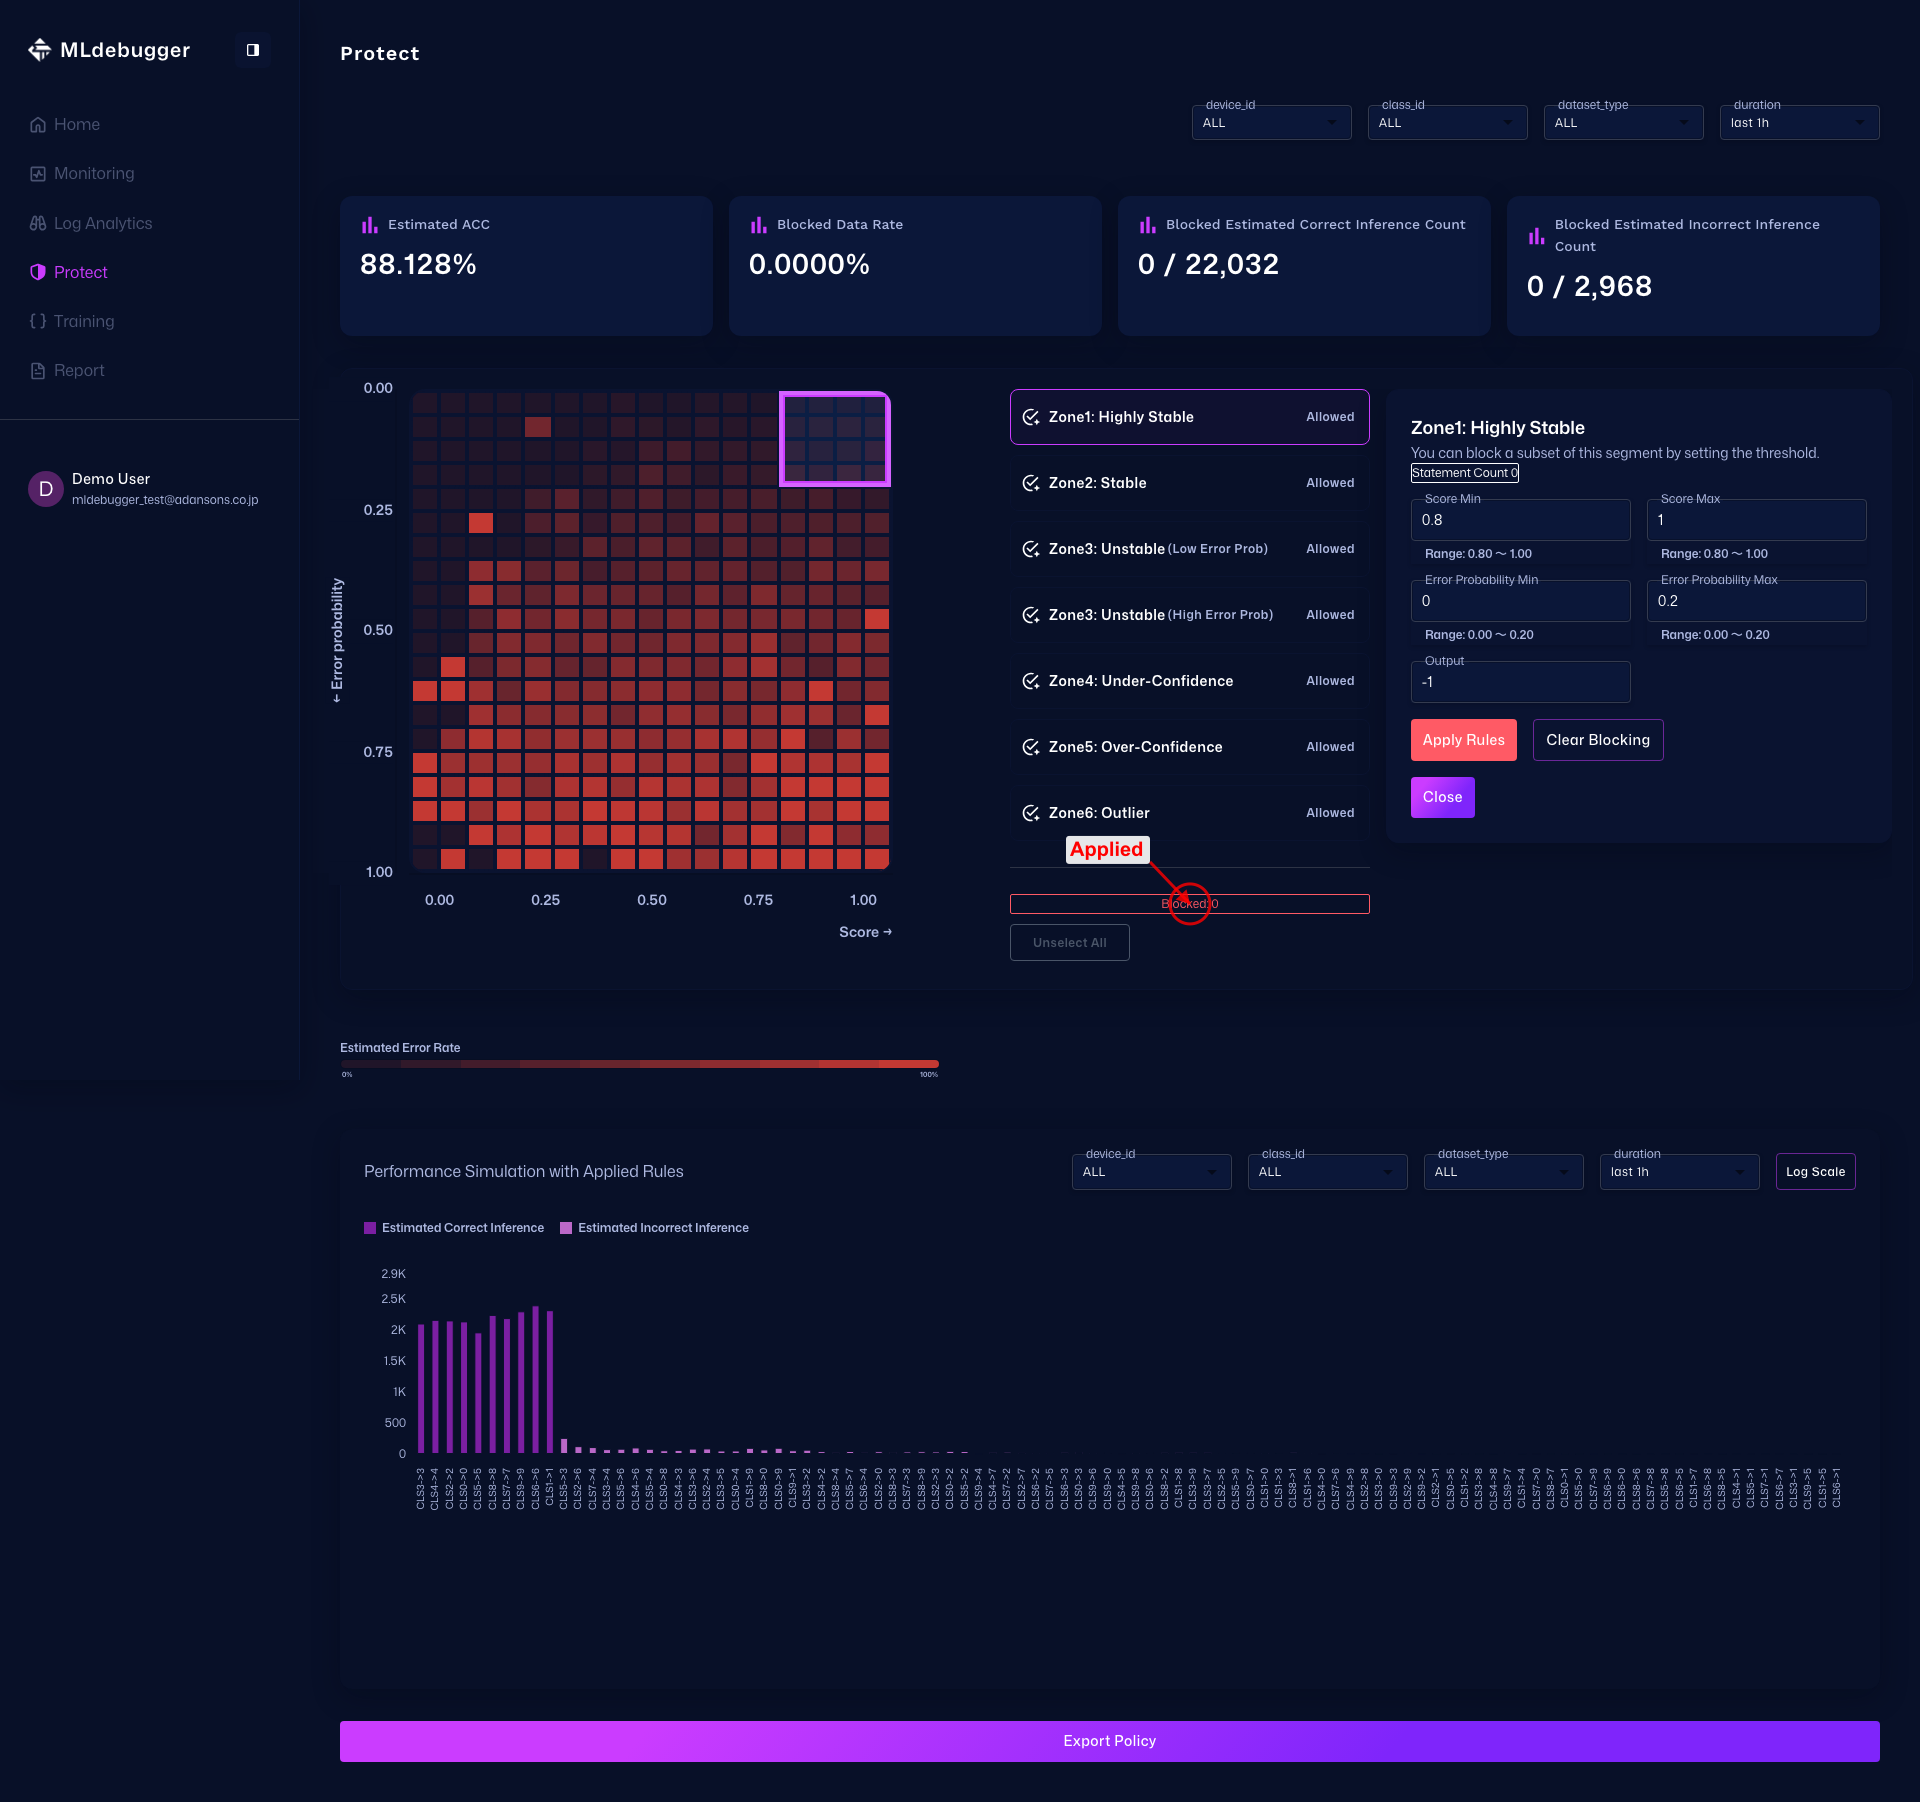
Zone Edit Panel
Press the Zone button to open the edit panel on the right side. Adjust the Score / Error Probability range, apply it with Apply Rules, and remove it with Clear Blocking.
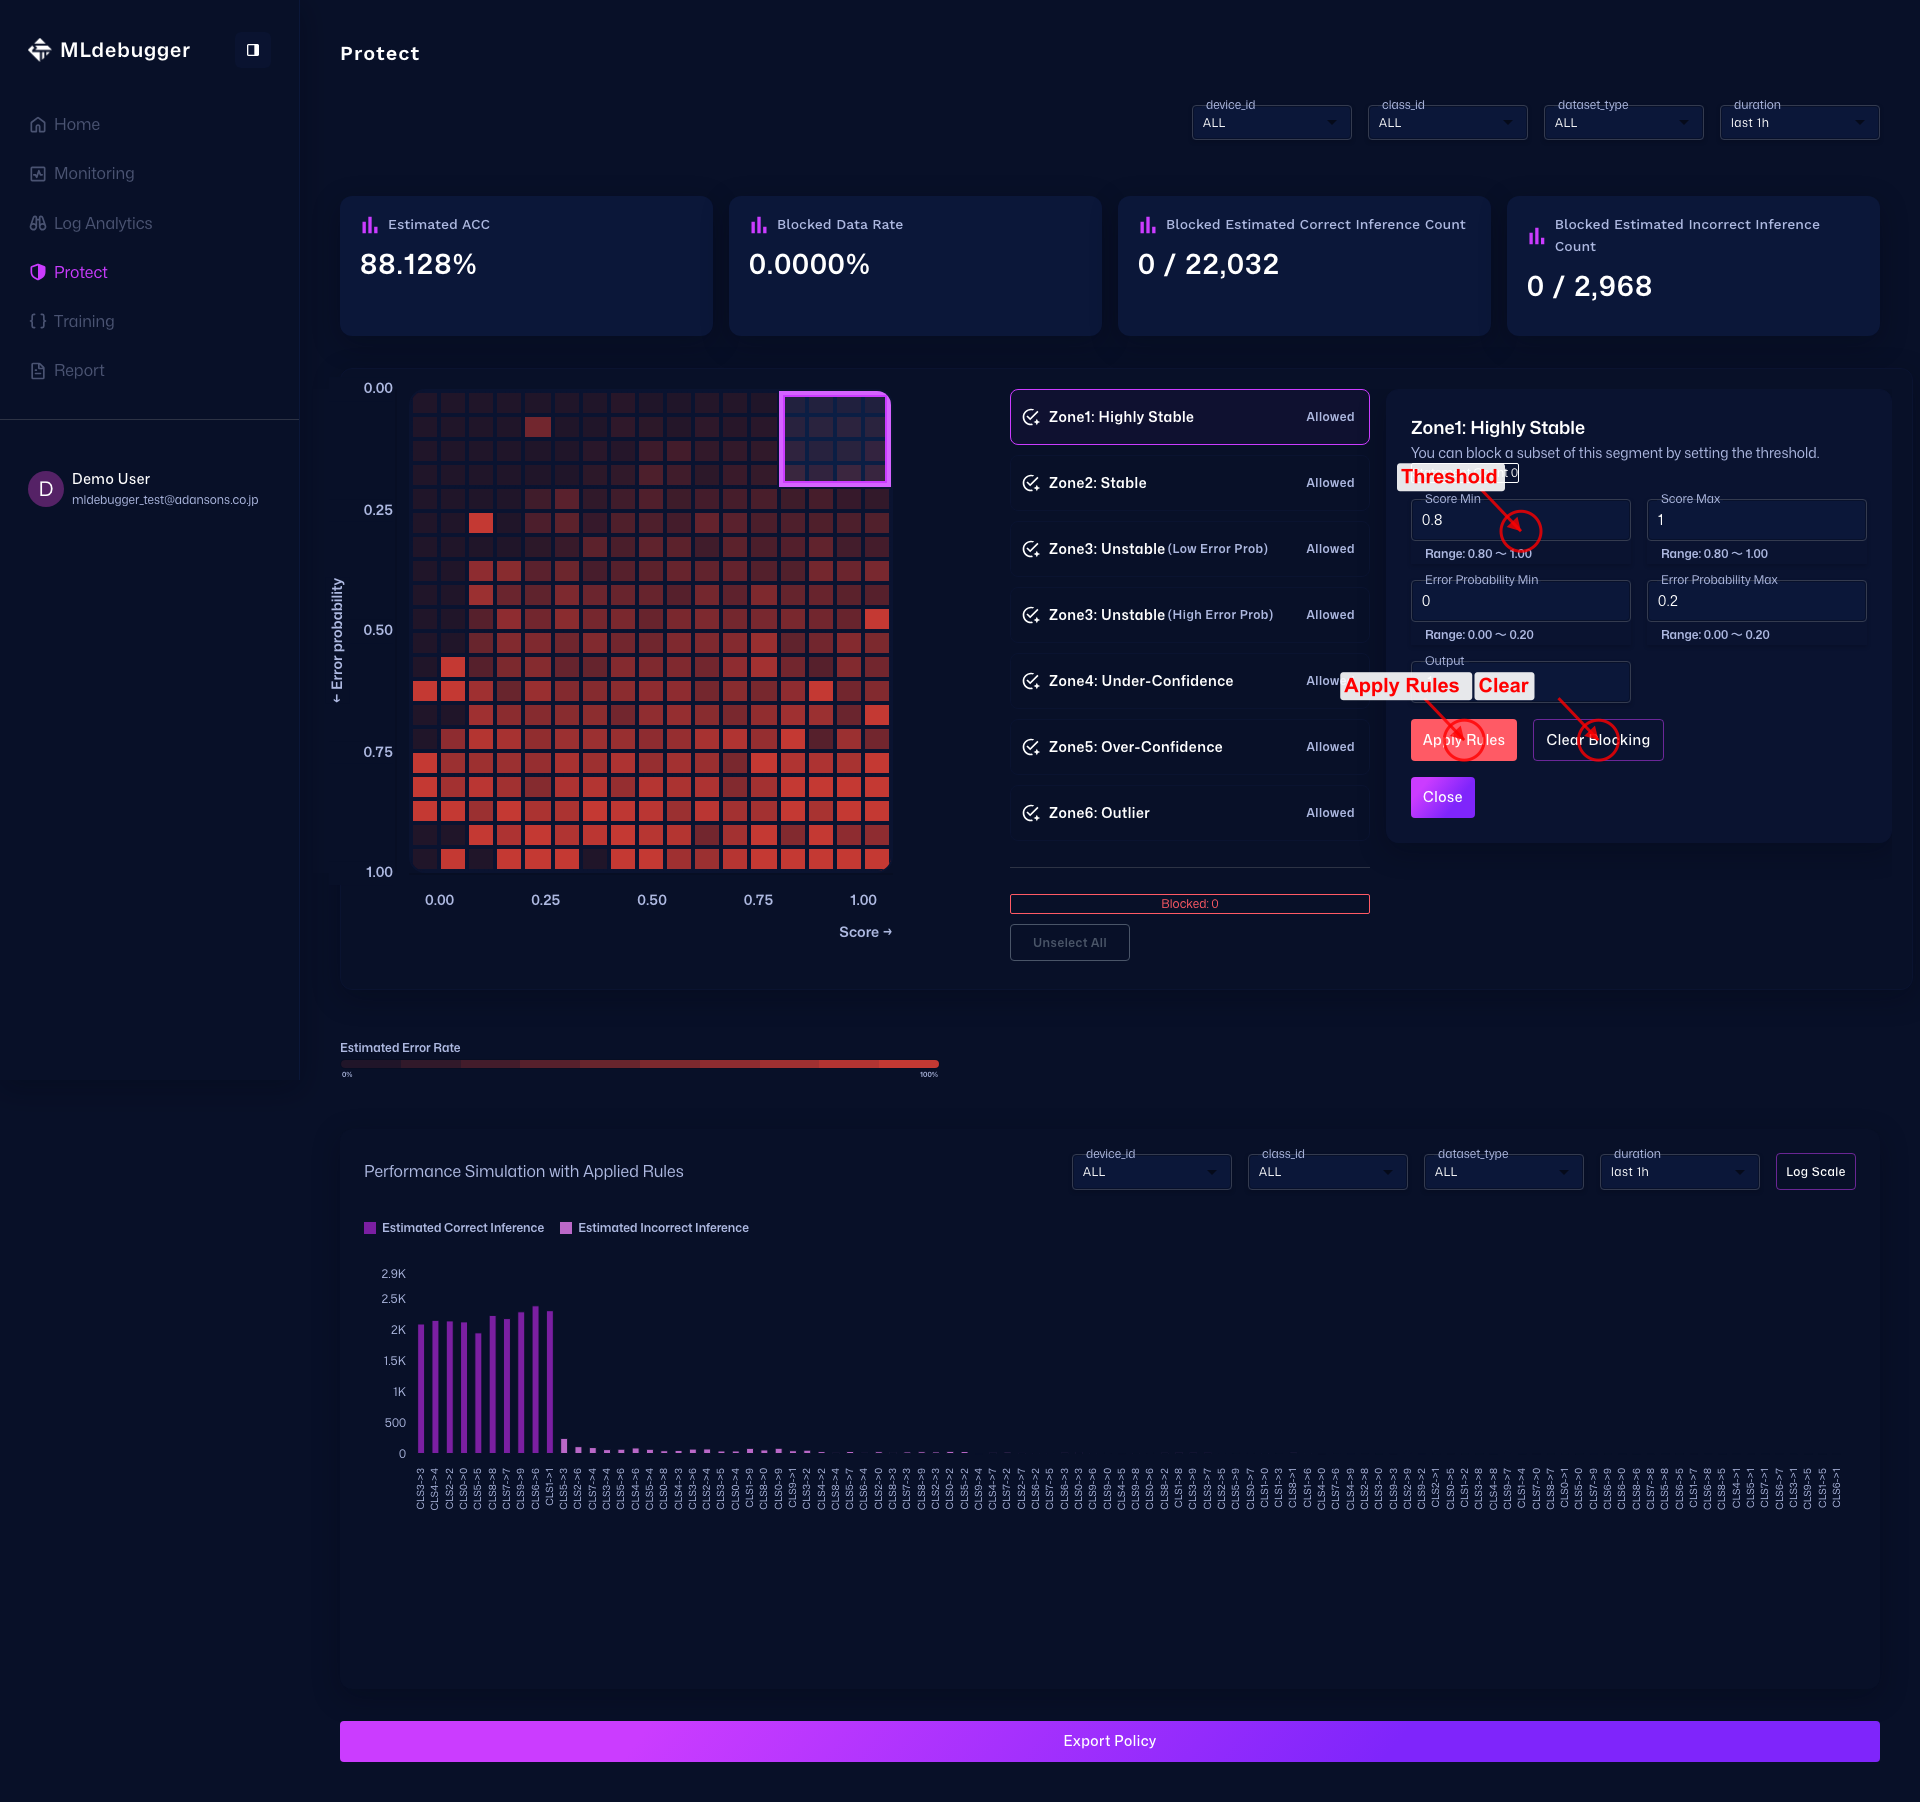
After Applying Rules
After Apply Rules is executed, cells that match the selected Zone conditions become blocking targets, and the changes are reflected in the Blocked counts and the lower simulation section.
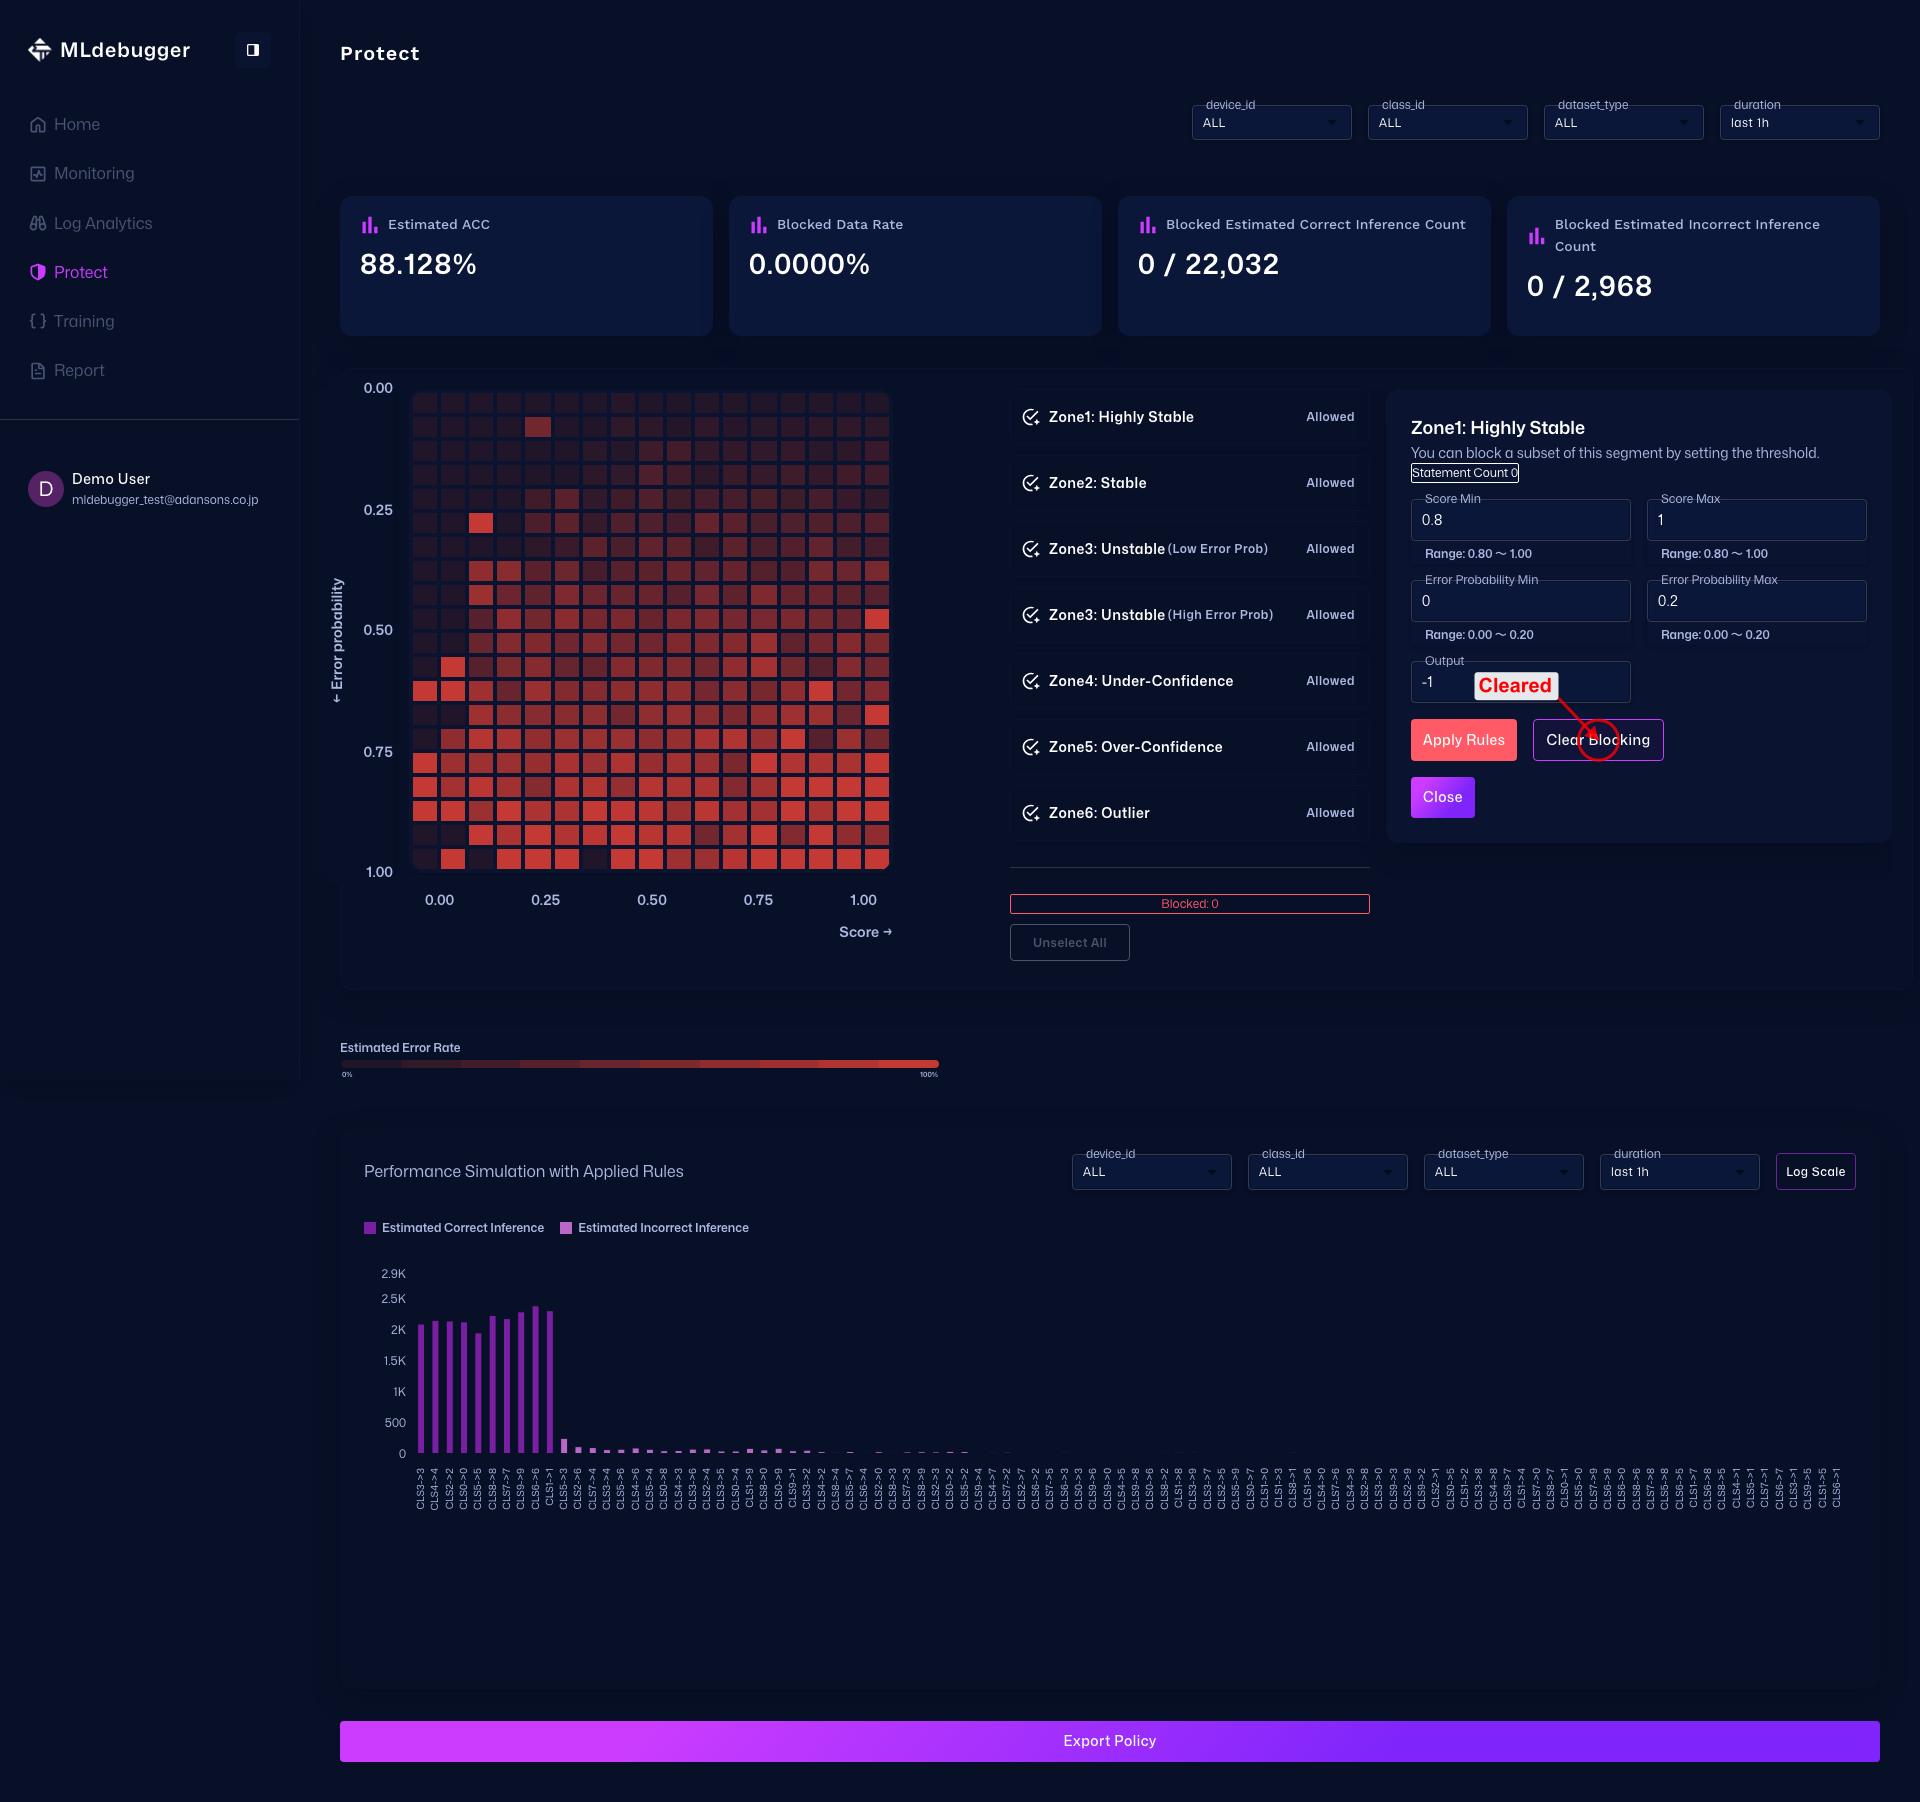
After Clearing Blocking
Use Clear Blocking to remove the blocking conditions for the Zone. To edit again, start over from the same Zone button.
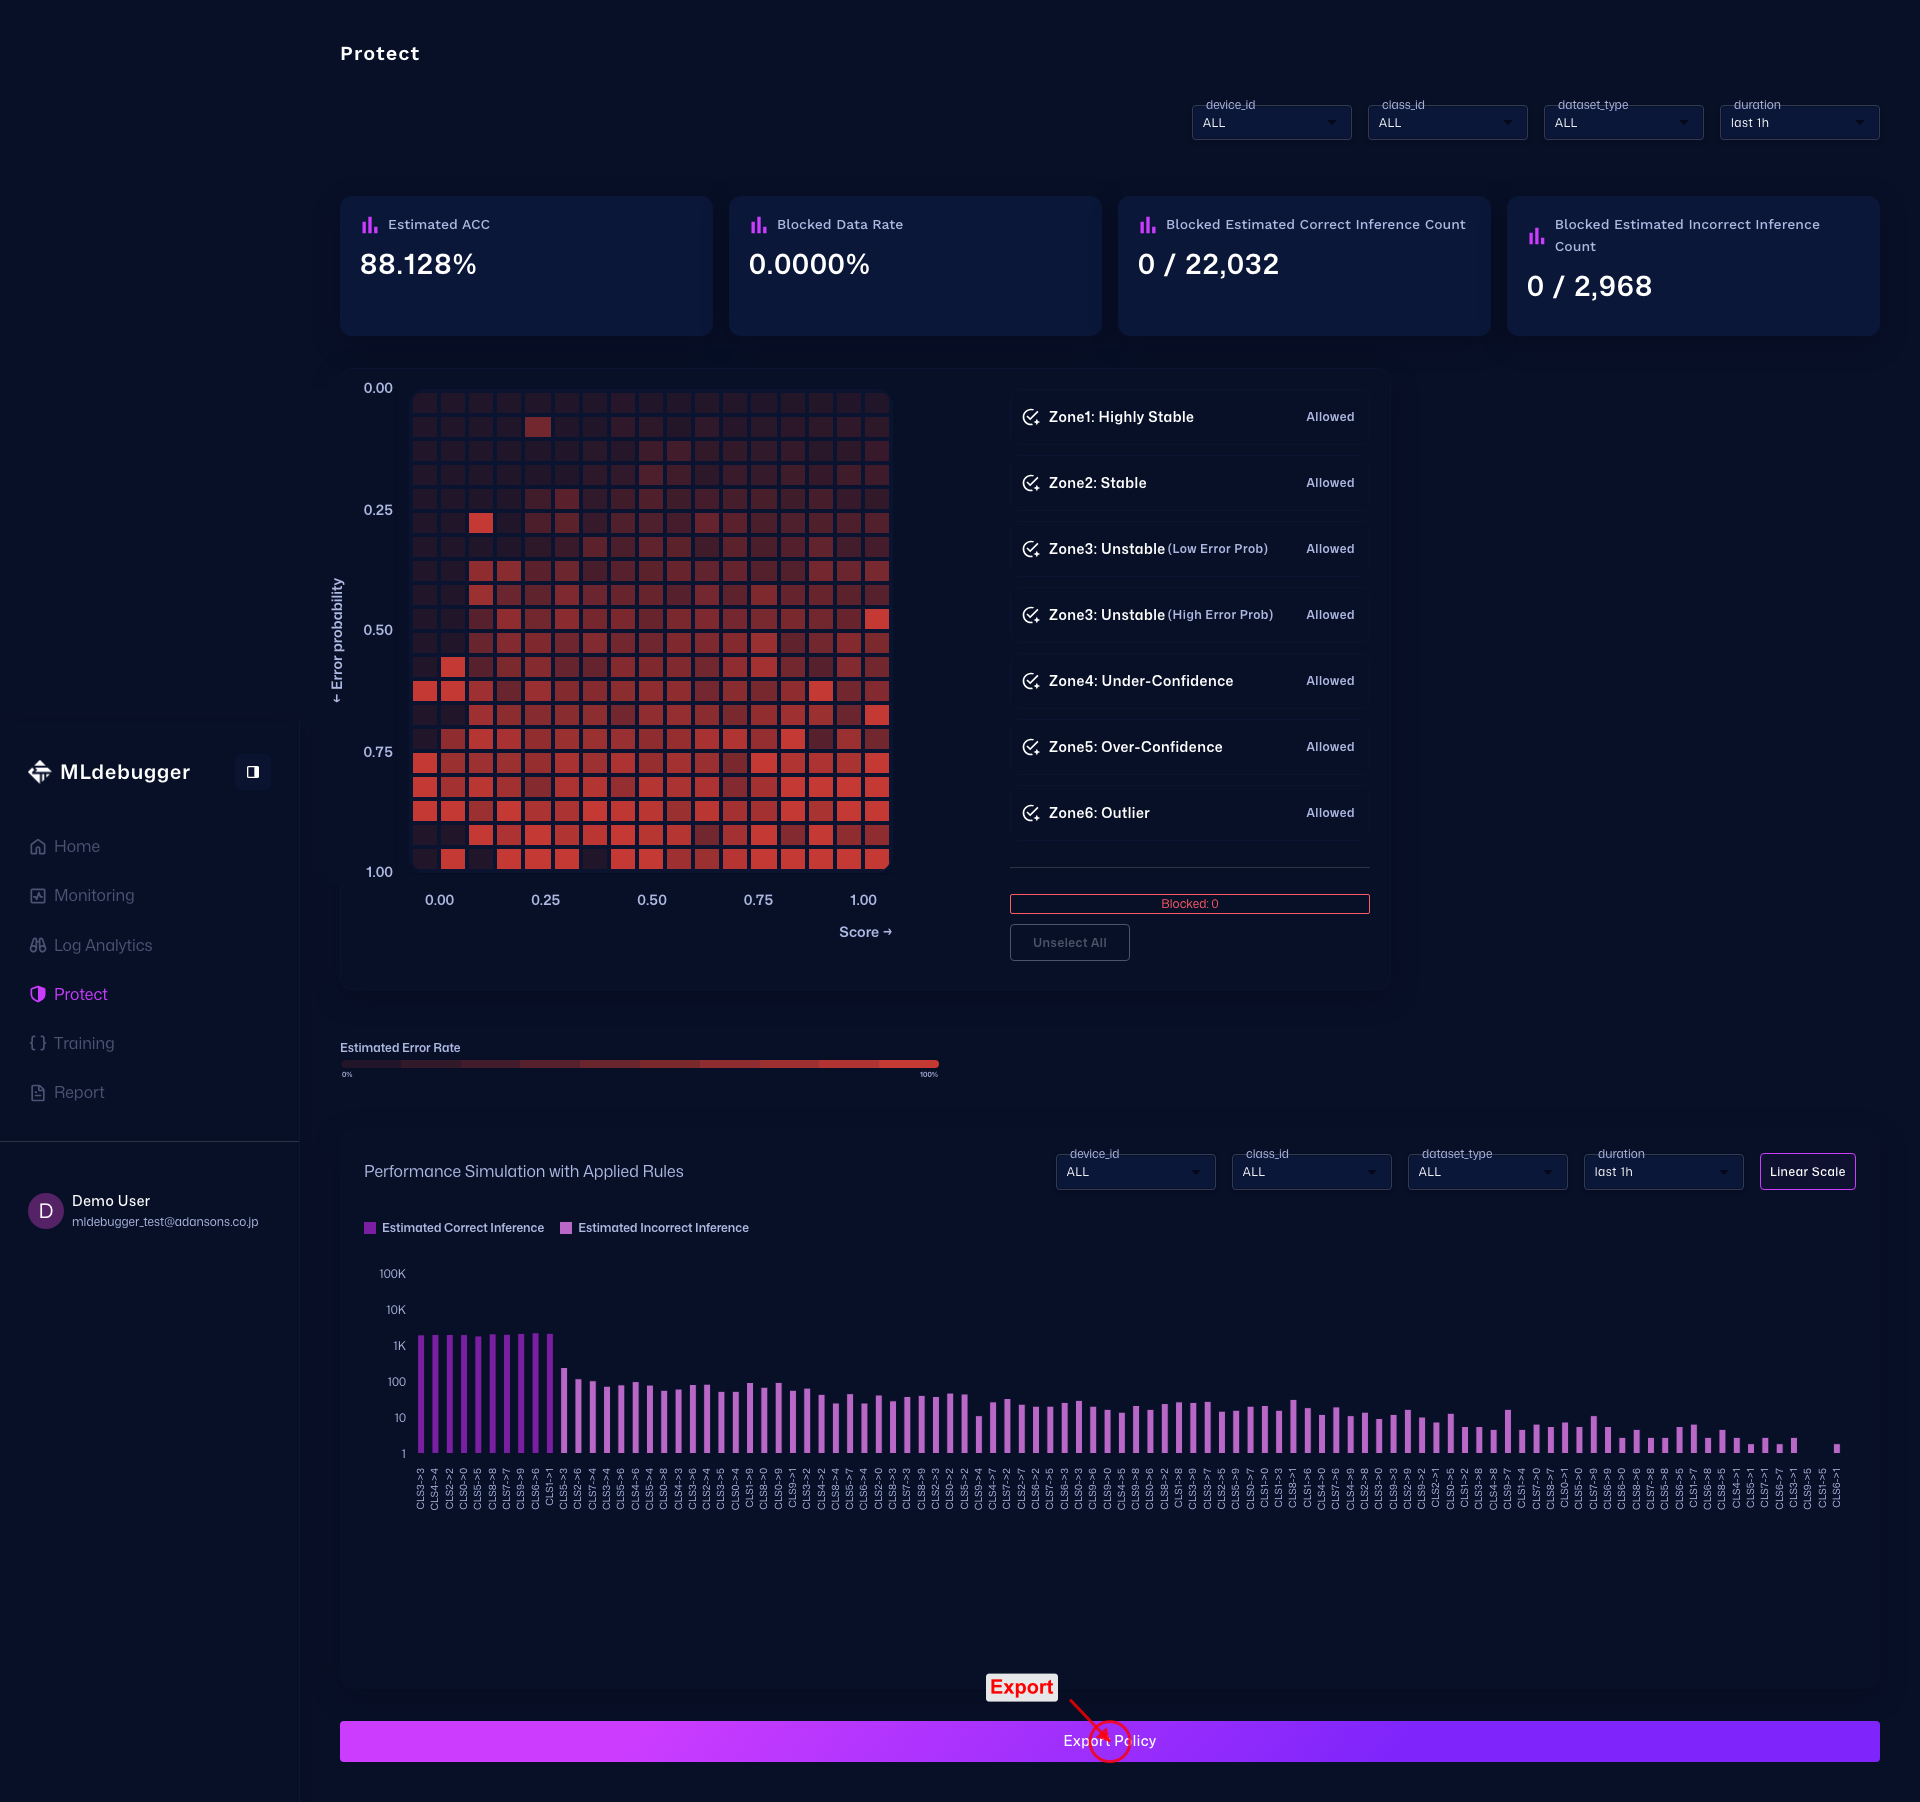
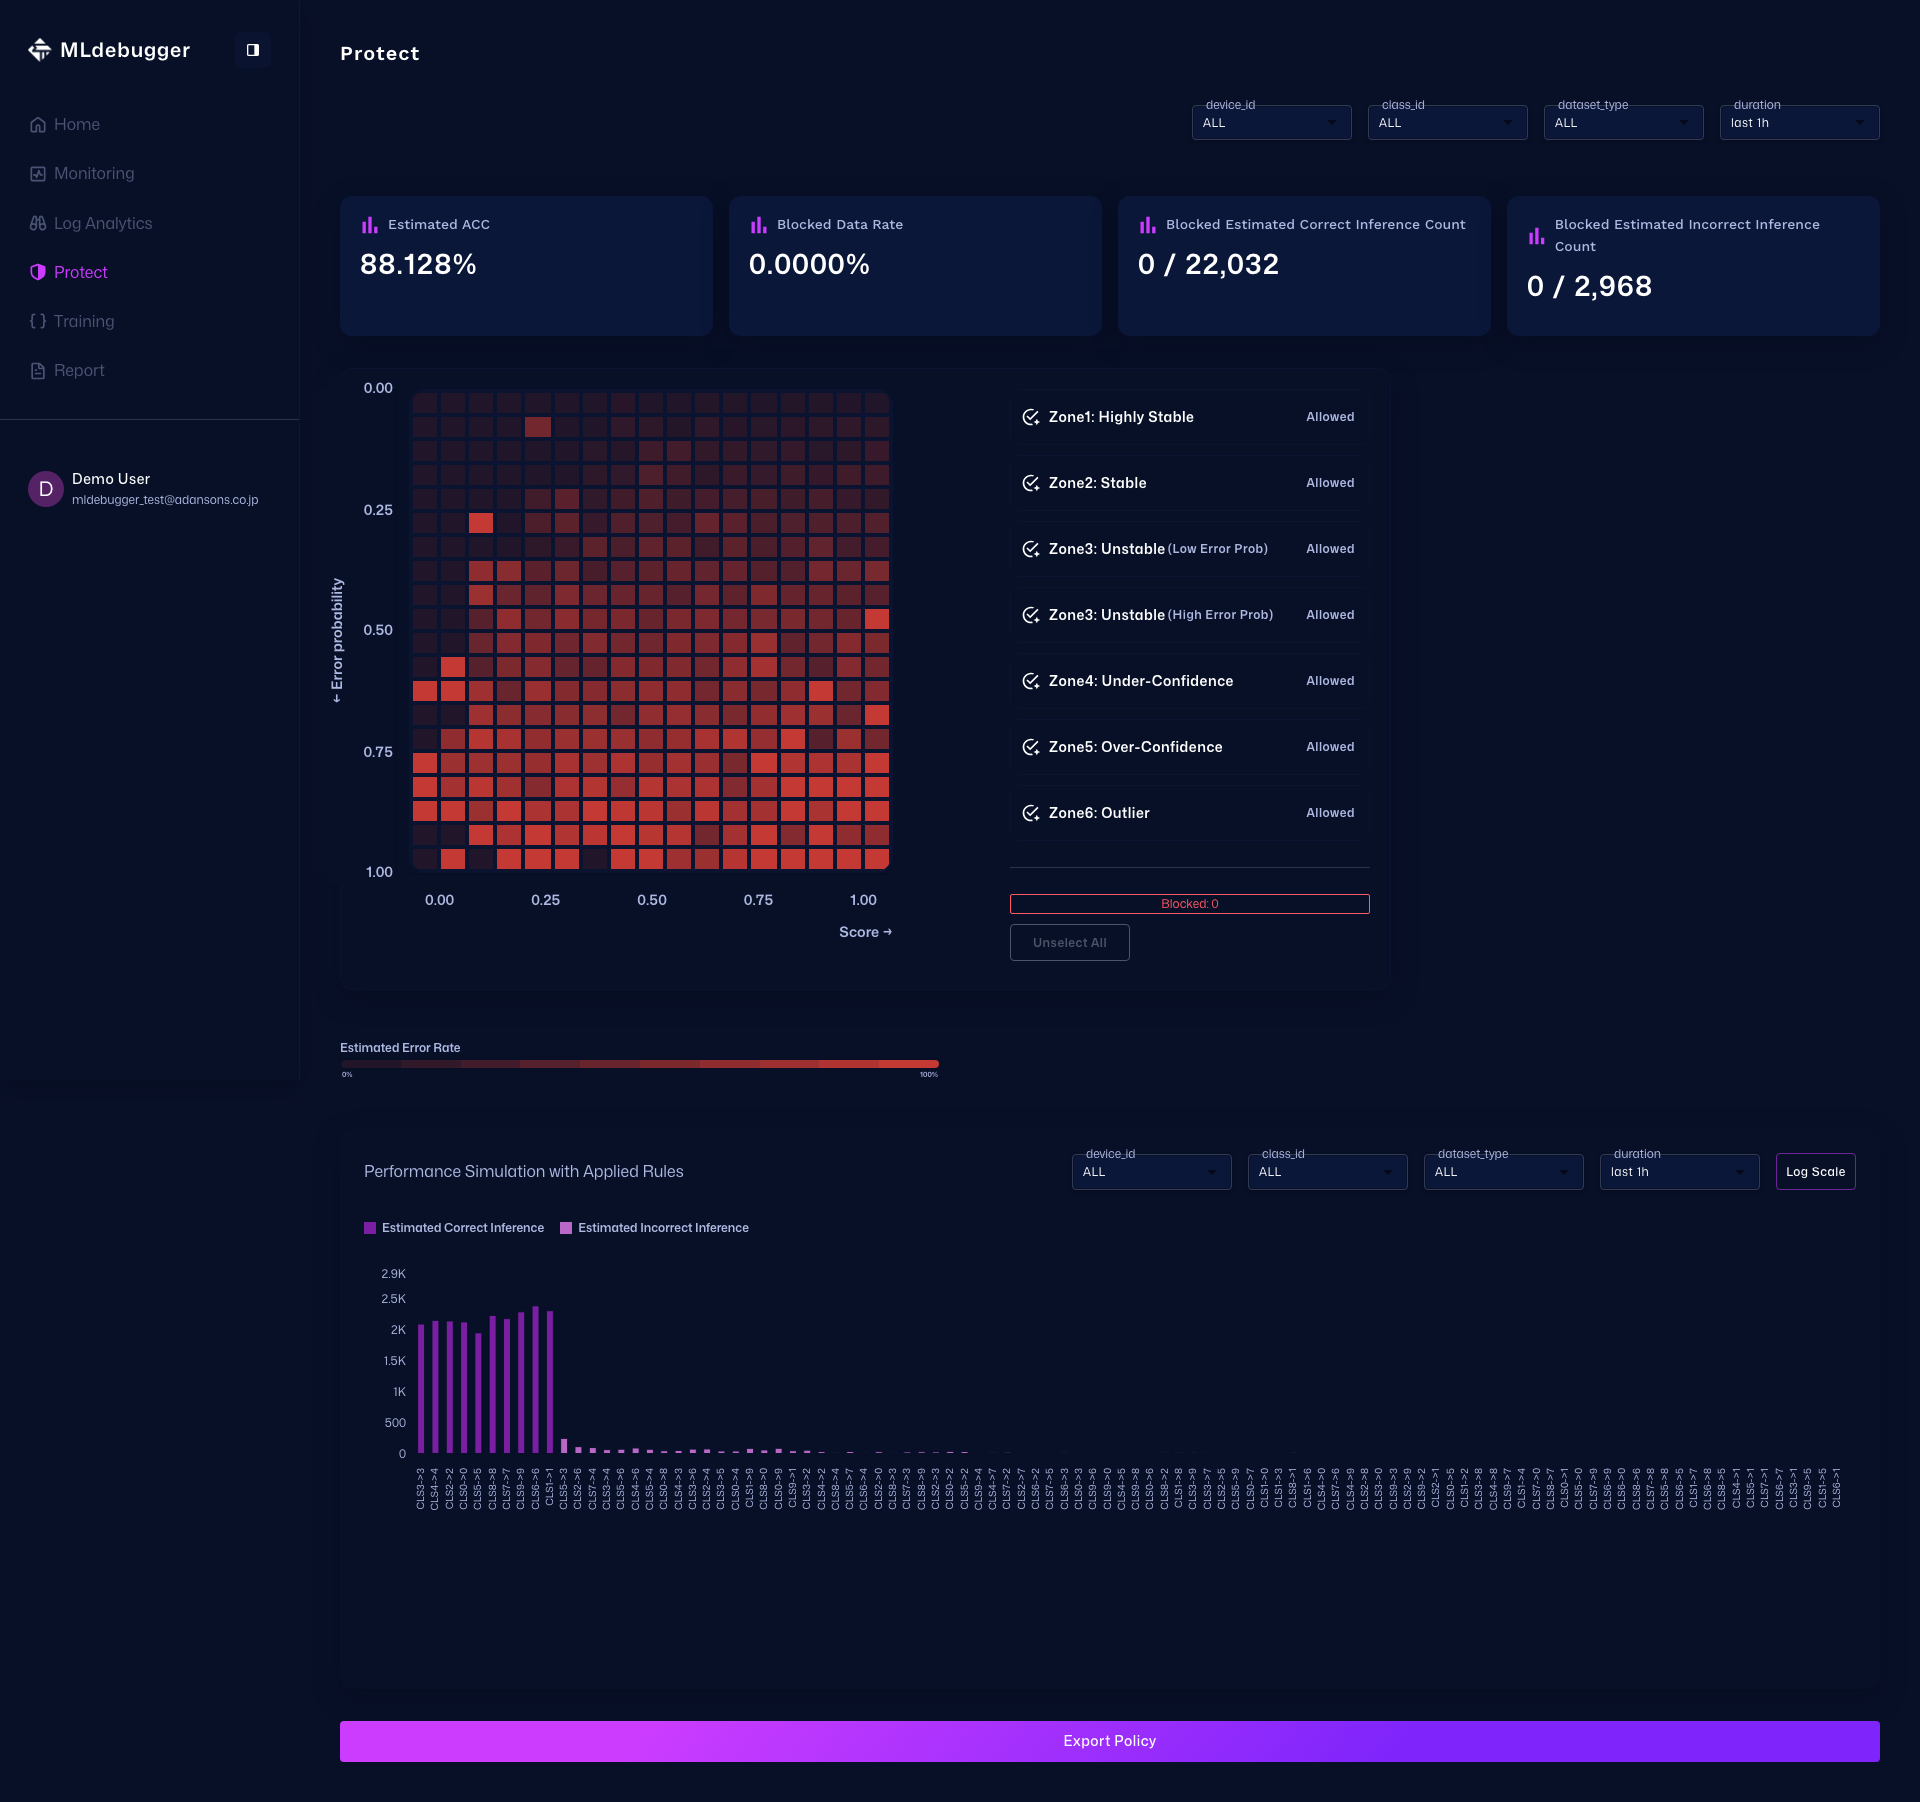
Log Scale
Press Log Scale to switch the histogram Y-axis to logarithmic display. This makes small differences easier to compare without being dominated by large values.
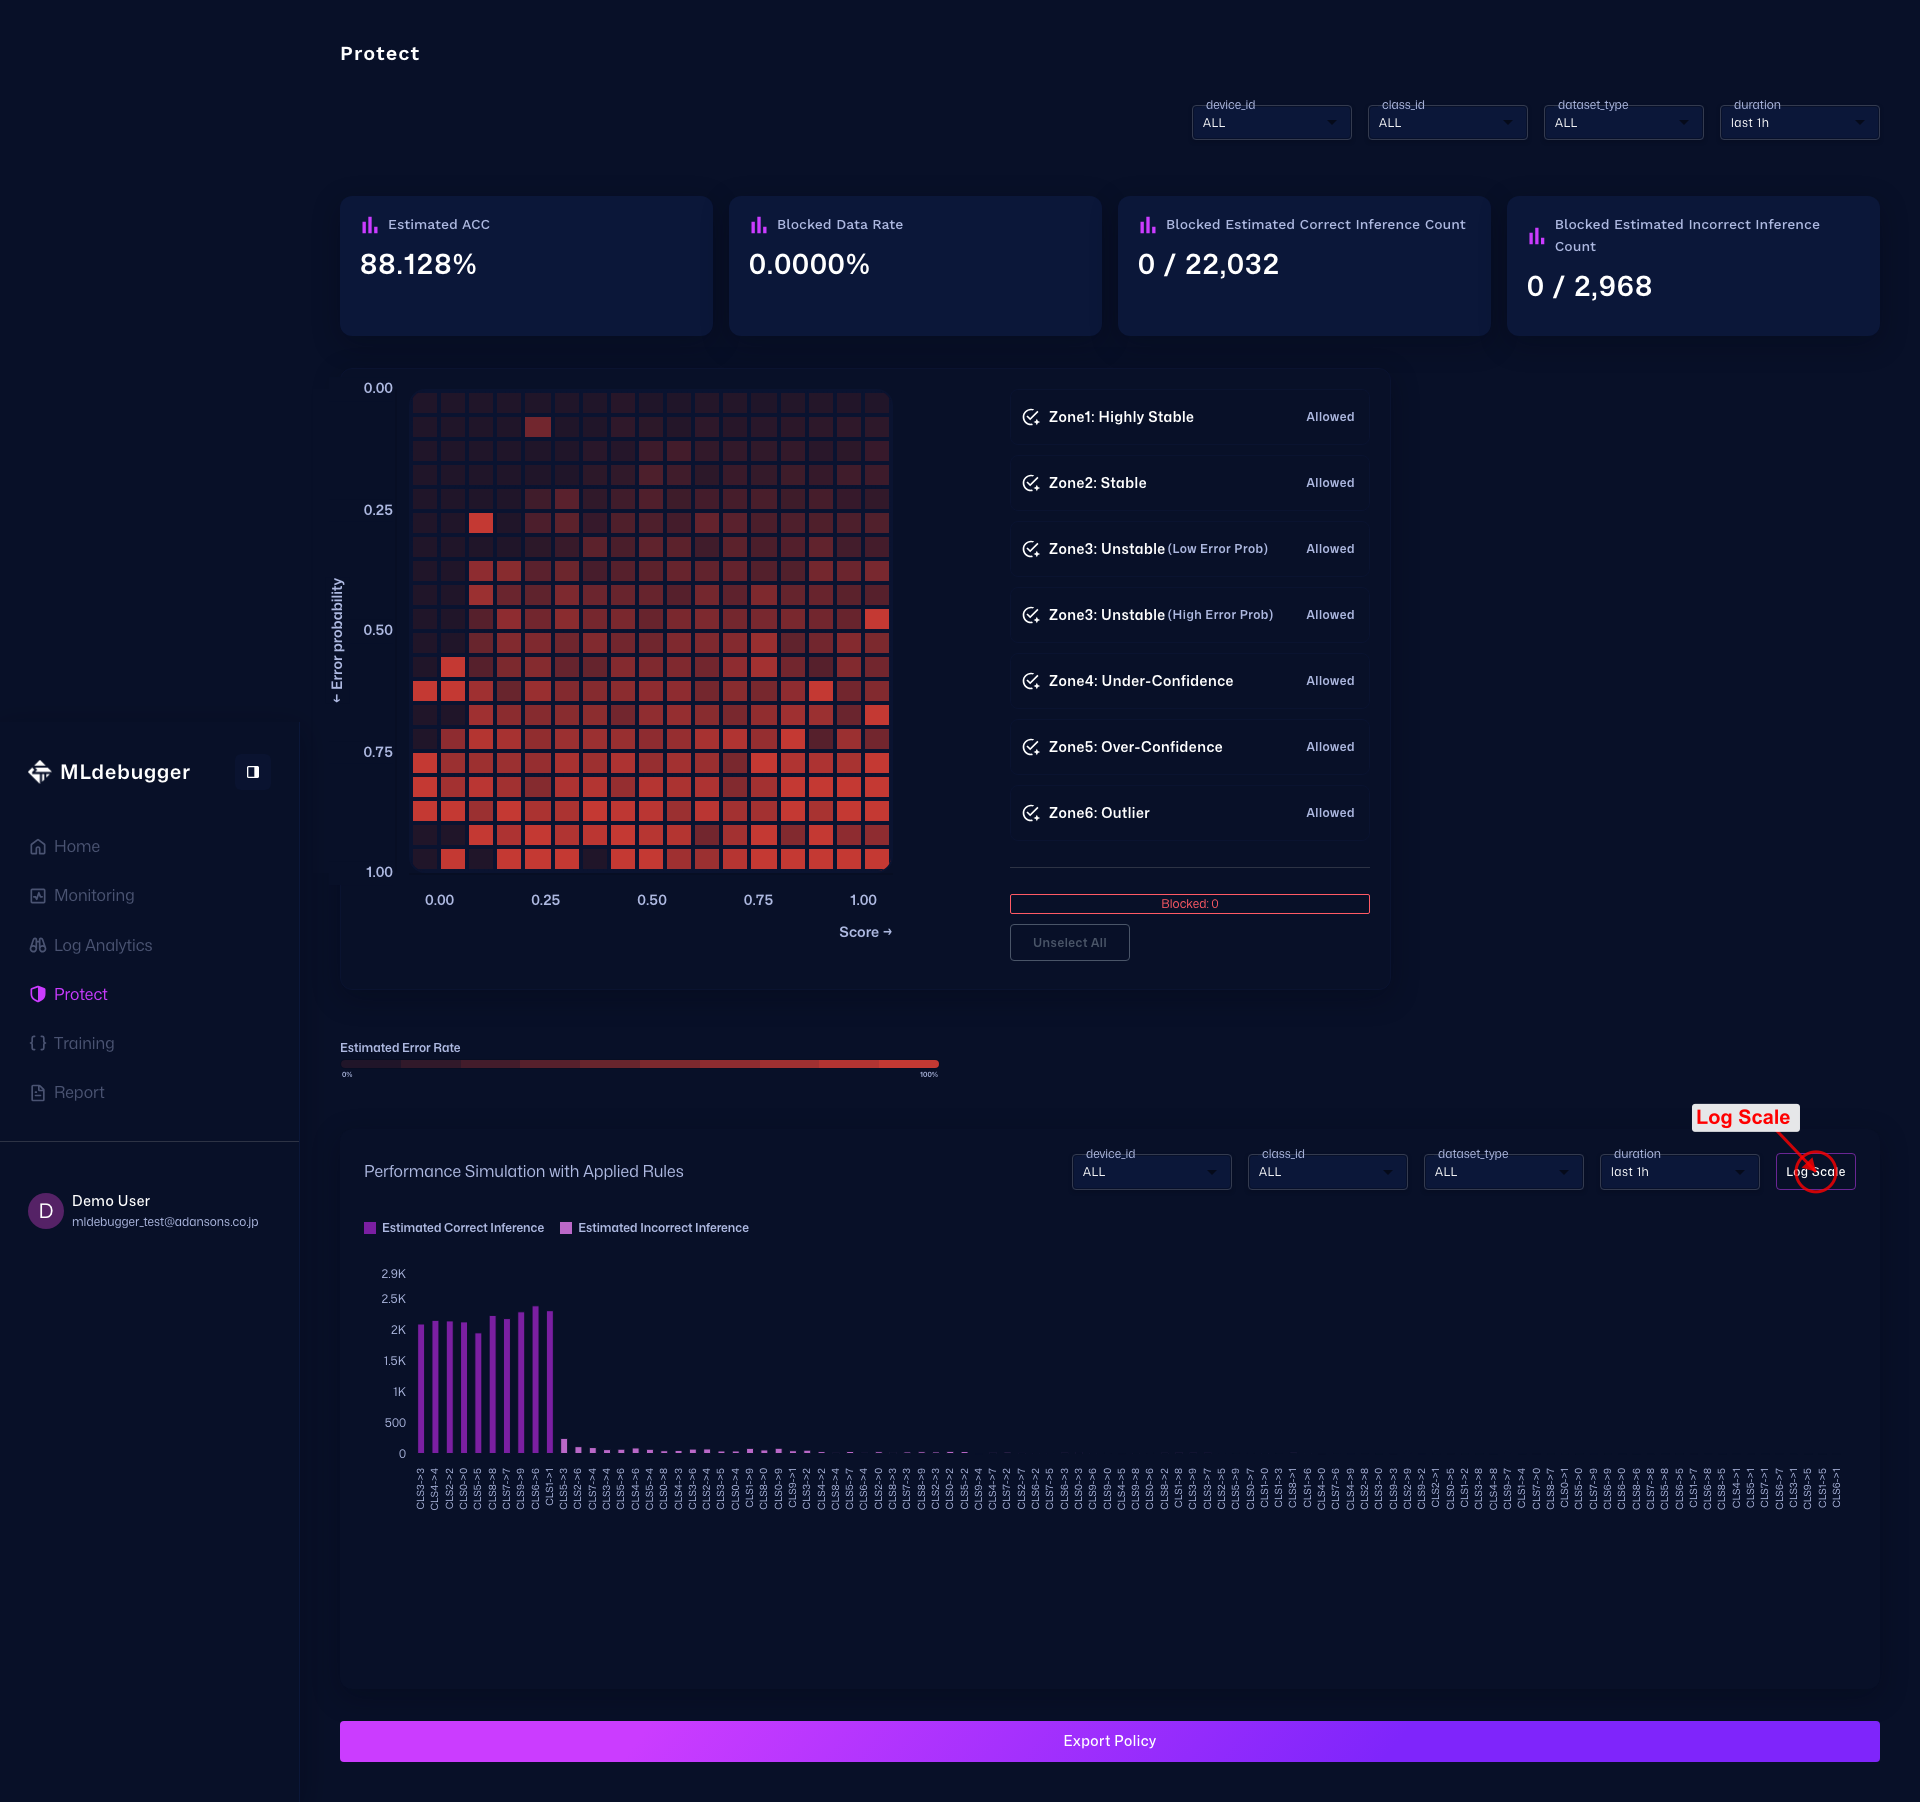
After Applying Log Scale
After pressing it, the button label changes to Linear Scale. Press it again to return to linear scale.

Export Policy
Export the configured rules for external integration. Use this to output policies that will be applied in the operational environment.