Training (Evaluation / Comparison / Query)
URL: https://app.adansons.ai/training
Screen Overview
Purpose
This is an integrated screen for GT-based evaluation, retraining query design, and model comparison.
It supports detailed analysis of training results, selection of retraining targets, and comparison across models in one continuous flow.
Key Features
Use the Evaluation / Debug Planning / Query / Compare tabs to perform evaluation analysis, data collection design, and comparison analysis.
Evaluation Tab
Tab Purpose
The Evaluation tab is used to review GT-based evaluation results and analyze model performance in detail.
Main Check Points
Review metrics and Behavior Trend to understand the overall performance trend of the model.
Operations and Screen Changes
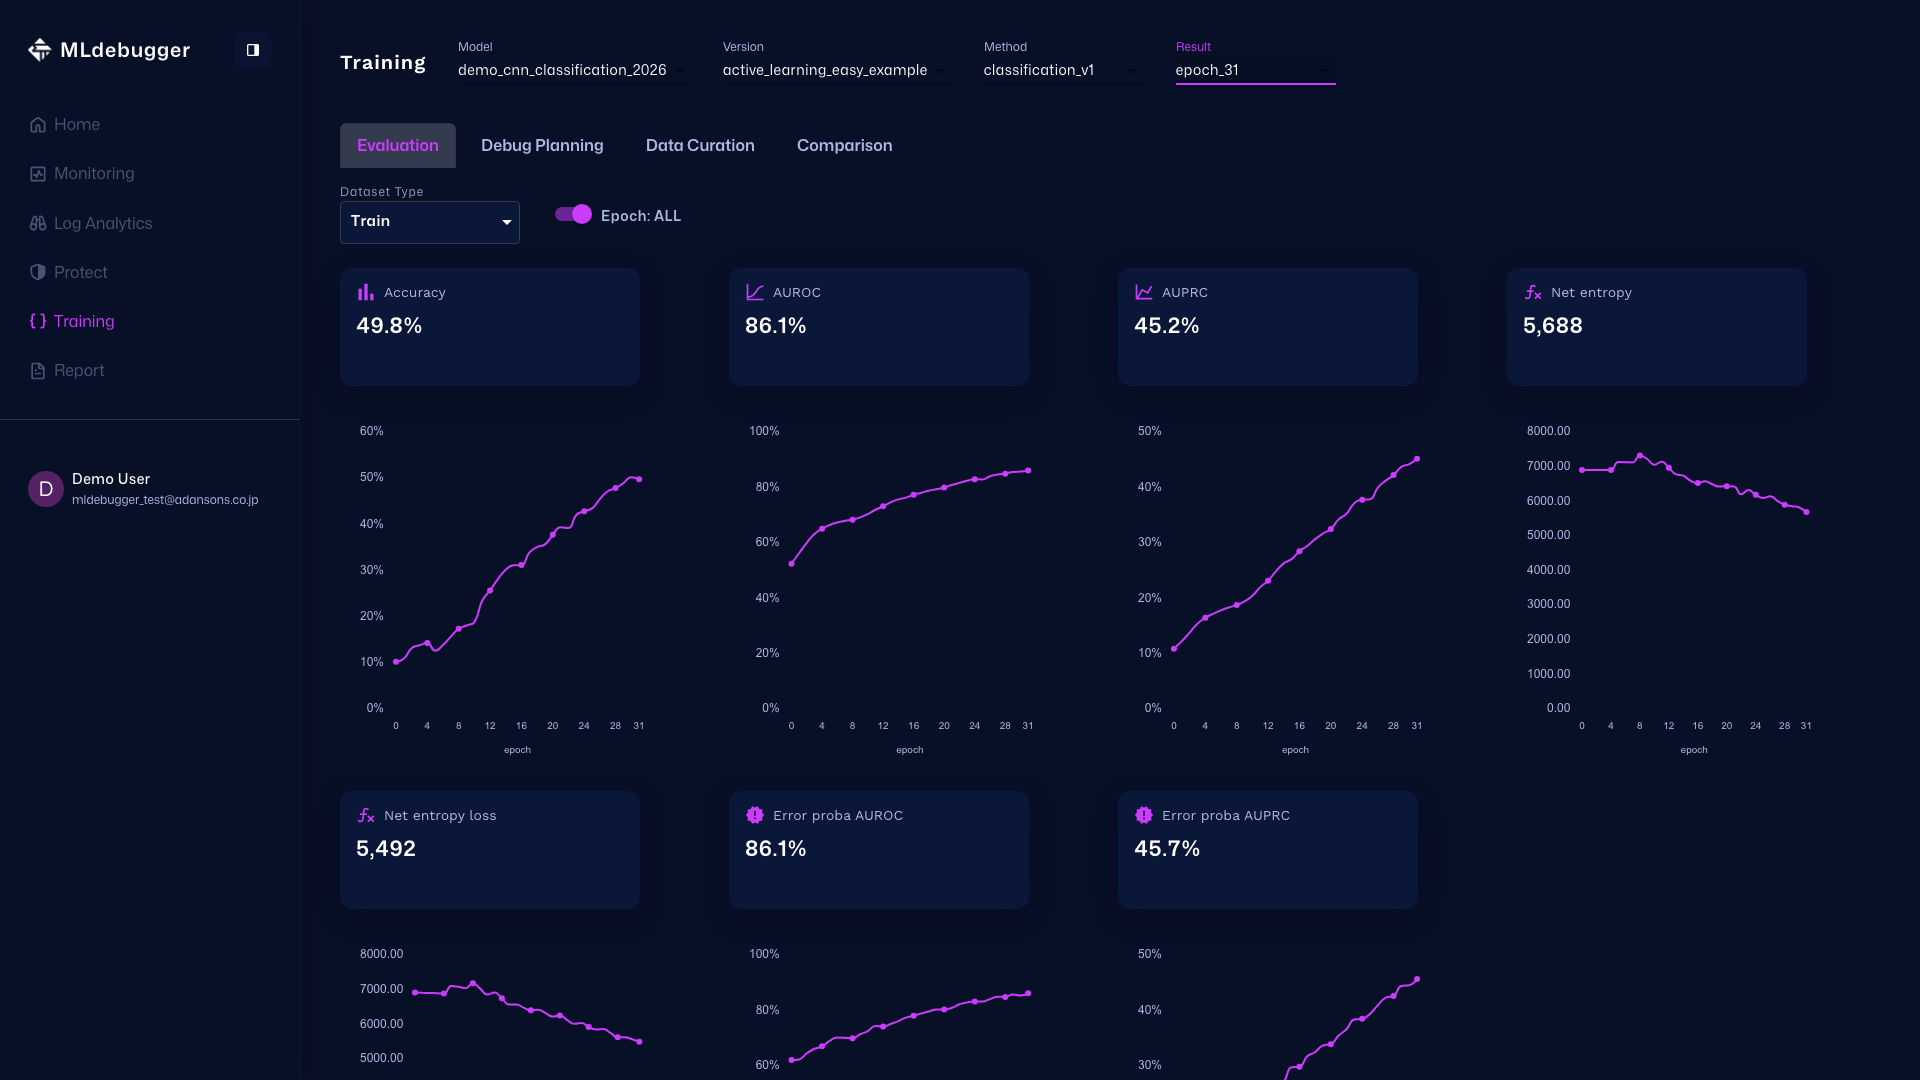
Top Section (Settings and Metrics)
Model/Version/Method/Result selection, Dataset Type, the Epoch toggle, and metric cards are displayed.
Settings:
- Model: demo_cnn_classification_2026
- Version: active_learning_easy_example
- Method: classification_v1
- Result: epoch31
- Dataset Type: Test
- Epoch: ALL
Behavior Trend Section
This section displays the relationship between Score and Error Probability as a heatmap. You can switch between By Count and By Error Rate modes.
When you change the Epoch with the slider at the bottom, you can check how the heatmap changes as training progresses. To start autoplay, first move the slider back to the far left and then press the play button.
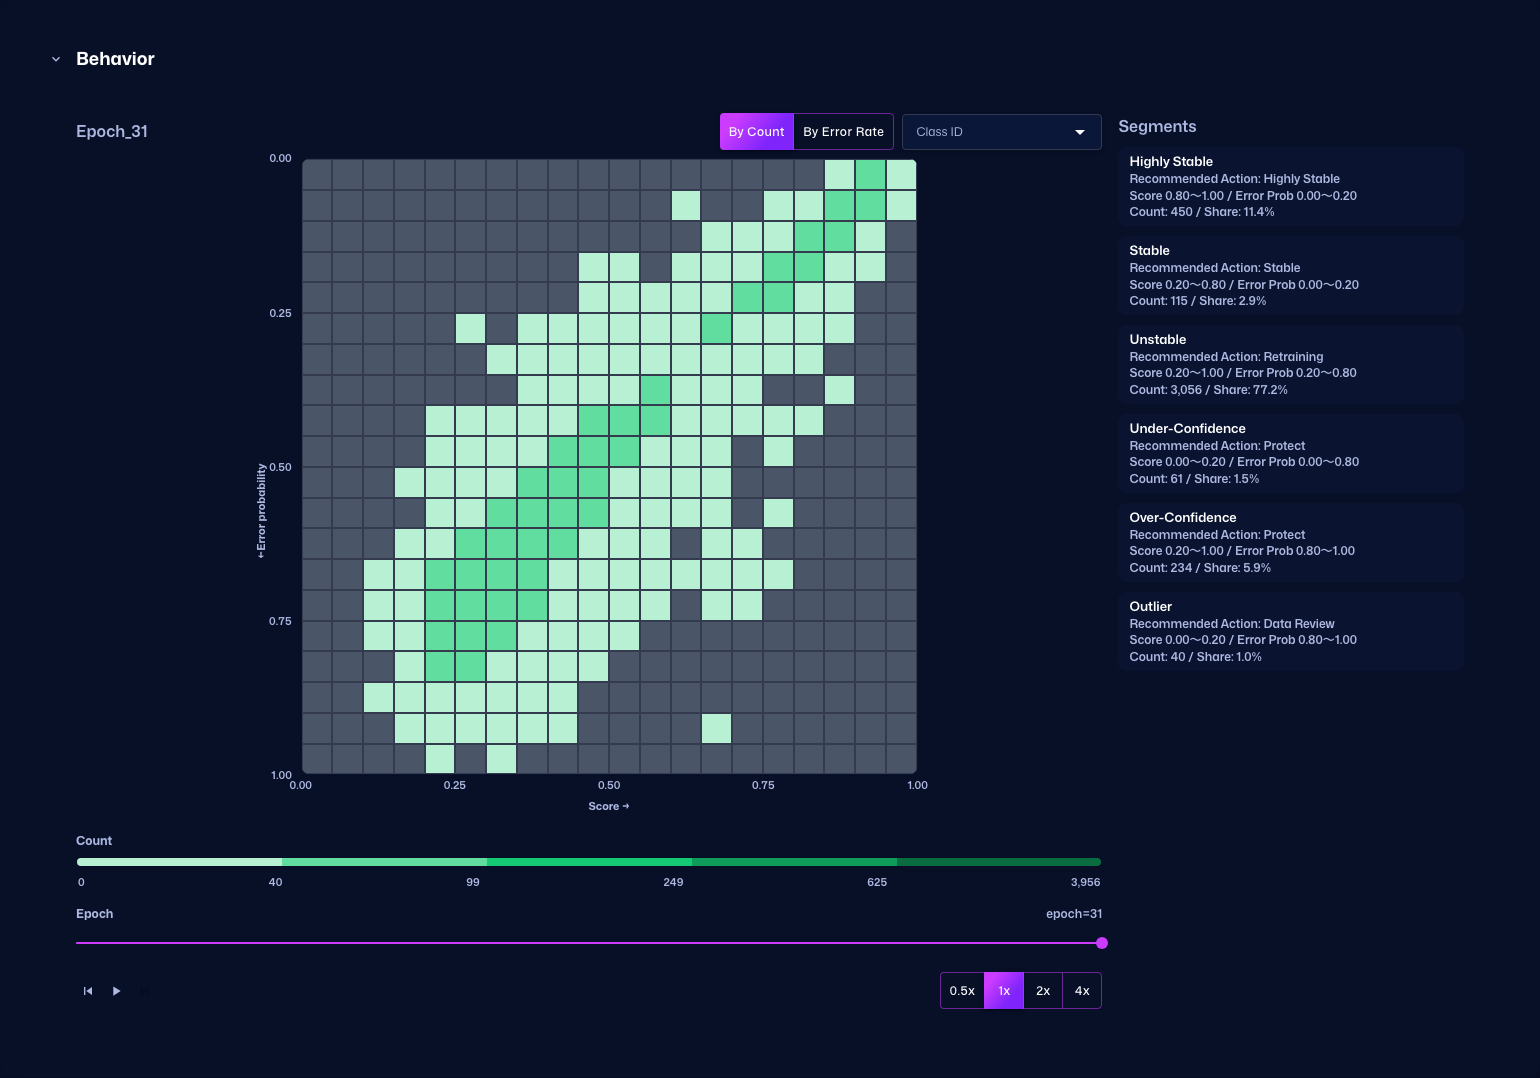
Behavior Trend (By Count)
Review the heatmap transition for each Epoch. In By Count mode, the color represents the number of data points that belong to each bin.
Behavior Trend (By Error Rate)
Review the heatmap transition for each Epoch. In By Error Rate mode, the color represents the error ratio of each bin relative to the entire heatmap.
Debug Planning Tab
Tab Purpose
The Debug Planning tab helps organize where to dig deeper by reviewing evaluation summaries and detailed results by dataset.
Main Check Points
Use Evaluation Summary by Dataset Type and Evaluation Details to drill into issues by dataset and category.
Operations and Screen Changes
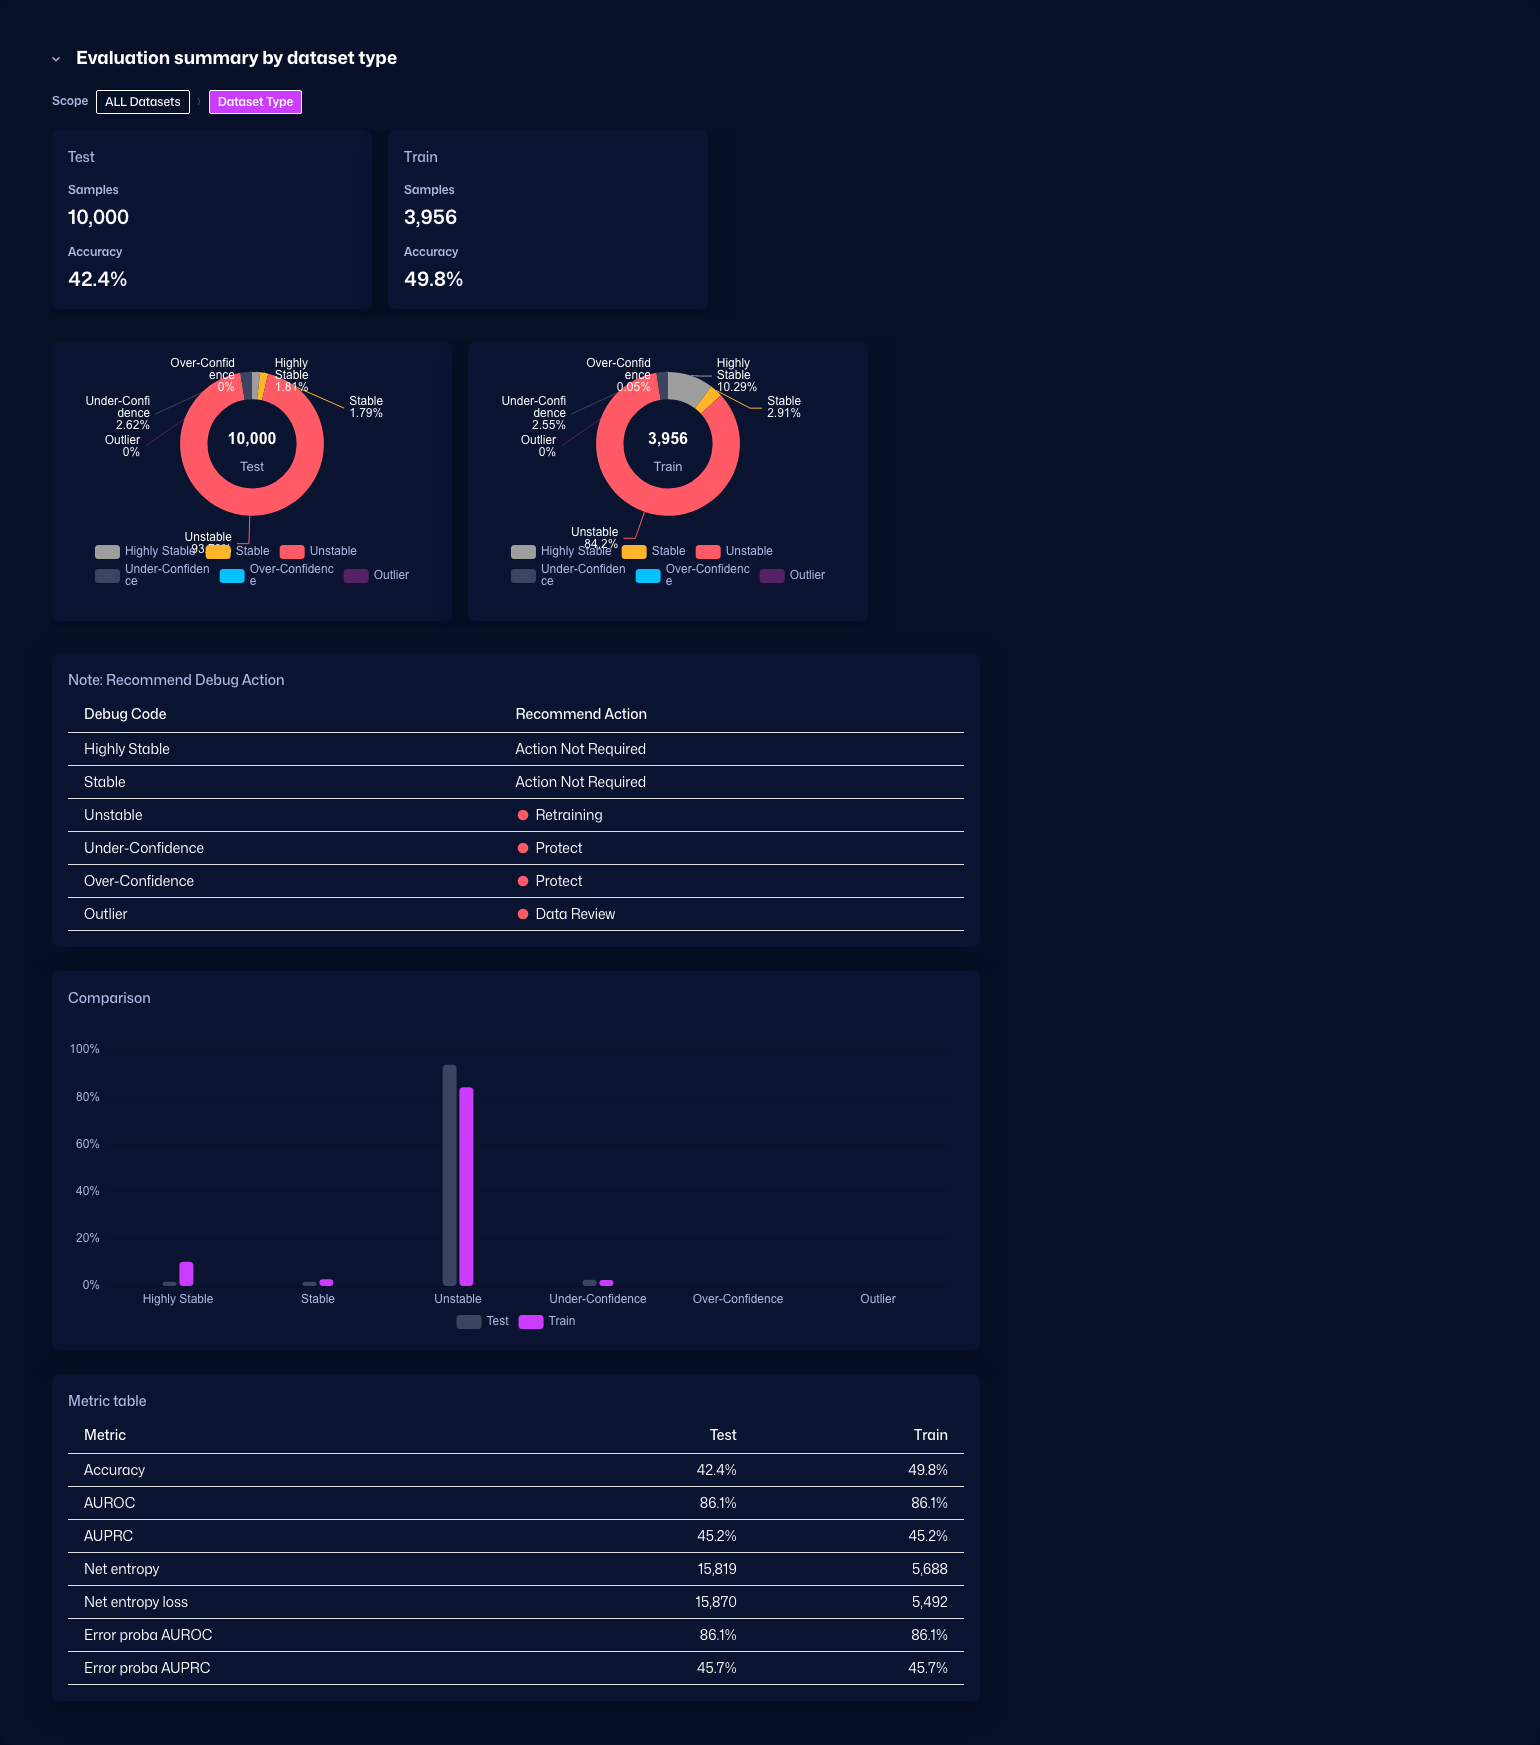
Evaluation Summary by Dataset Type
Displays an evaluation summary for each dataset type. It includes recommended debugging actions, comparison graphs, and metric tables.
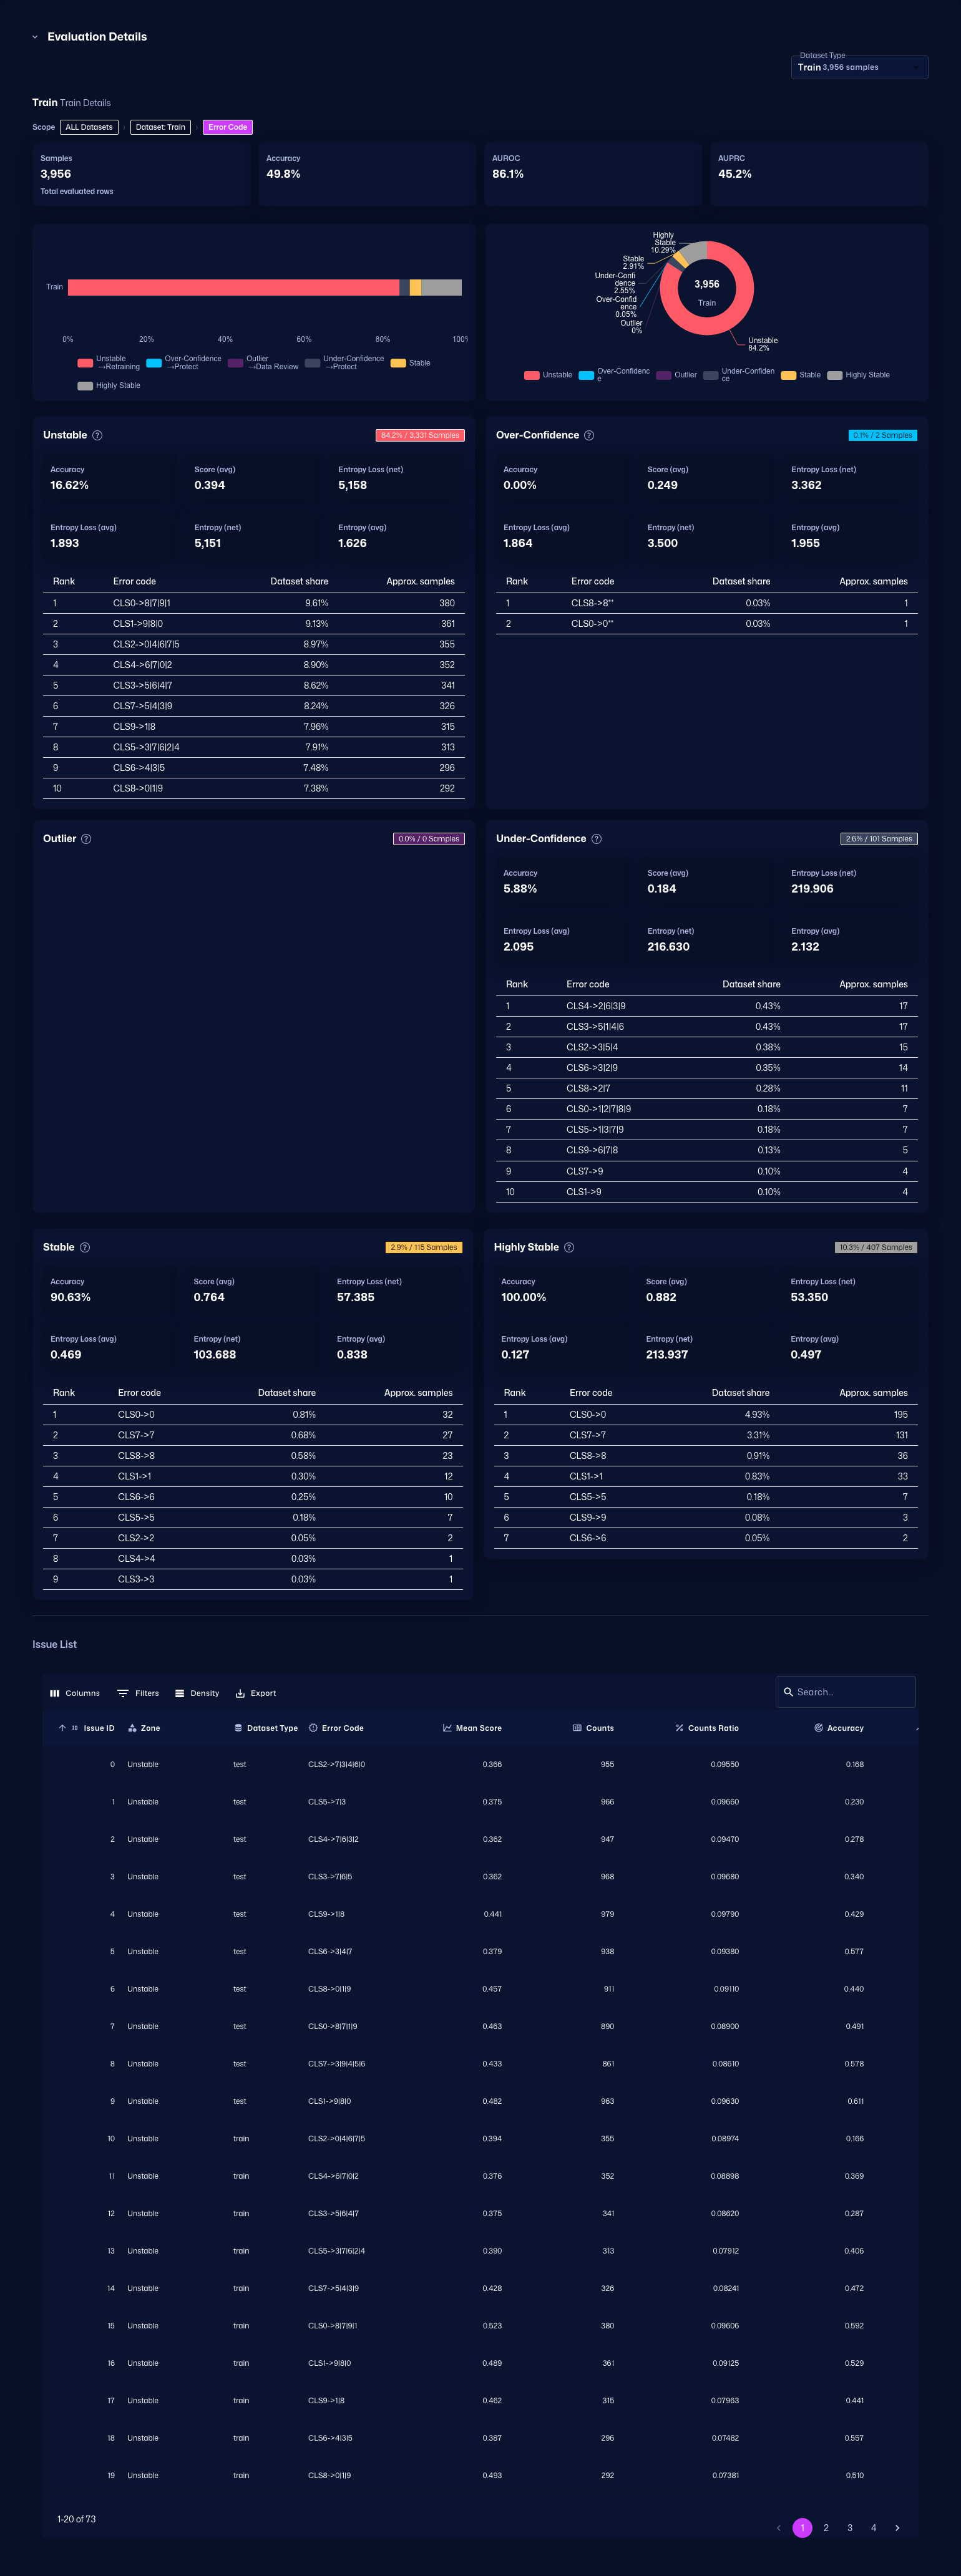
Evaluation Details
Displays detailed evaluation for each class. Use the Issue List to inspect problems by class.
Query Tab
Tab Purpose
The Query tab is used to design collection conditions for retraining data.
Main Check Points
Use the heatmap and segment operations to examine collection targets and turn the selection policy for retraining data into concrete conditions.
Operations and Screen Changes
Query Tab
Use the heatmap and segment operations to examine what data conditions should be collected for retraining.
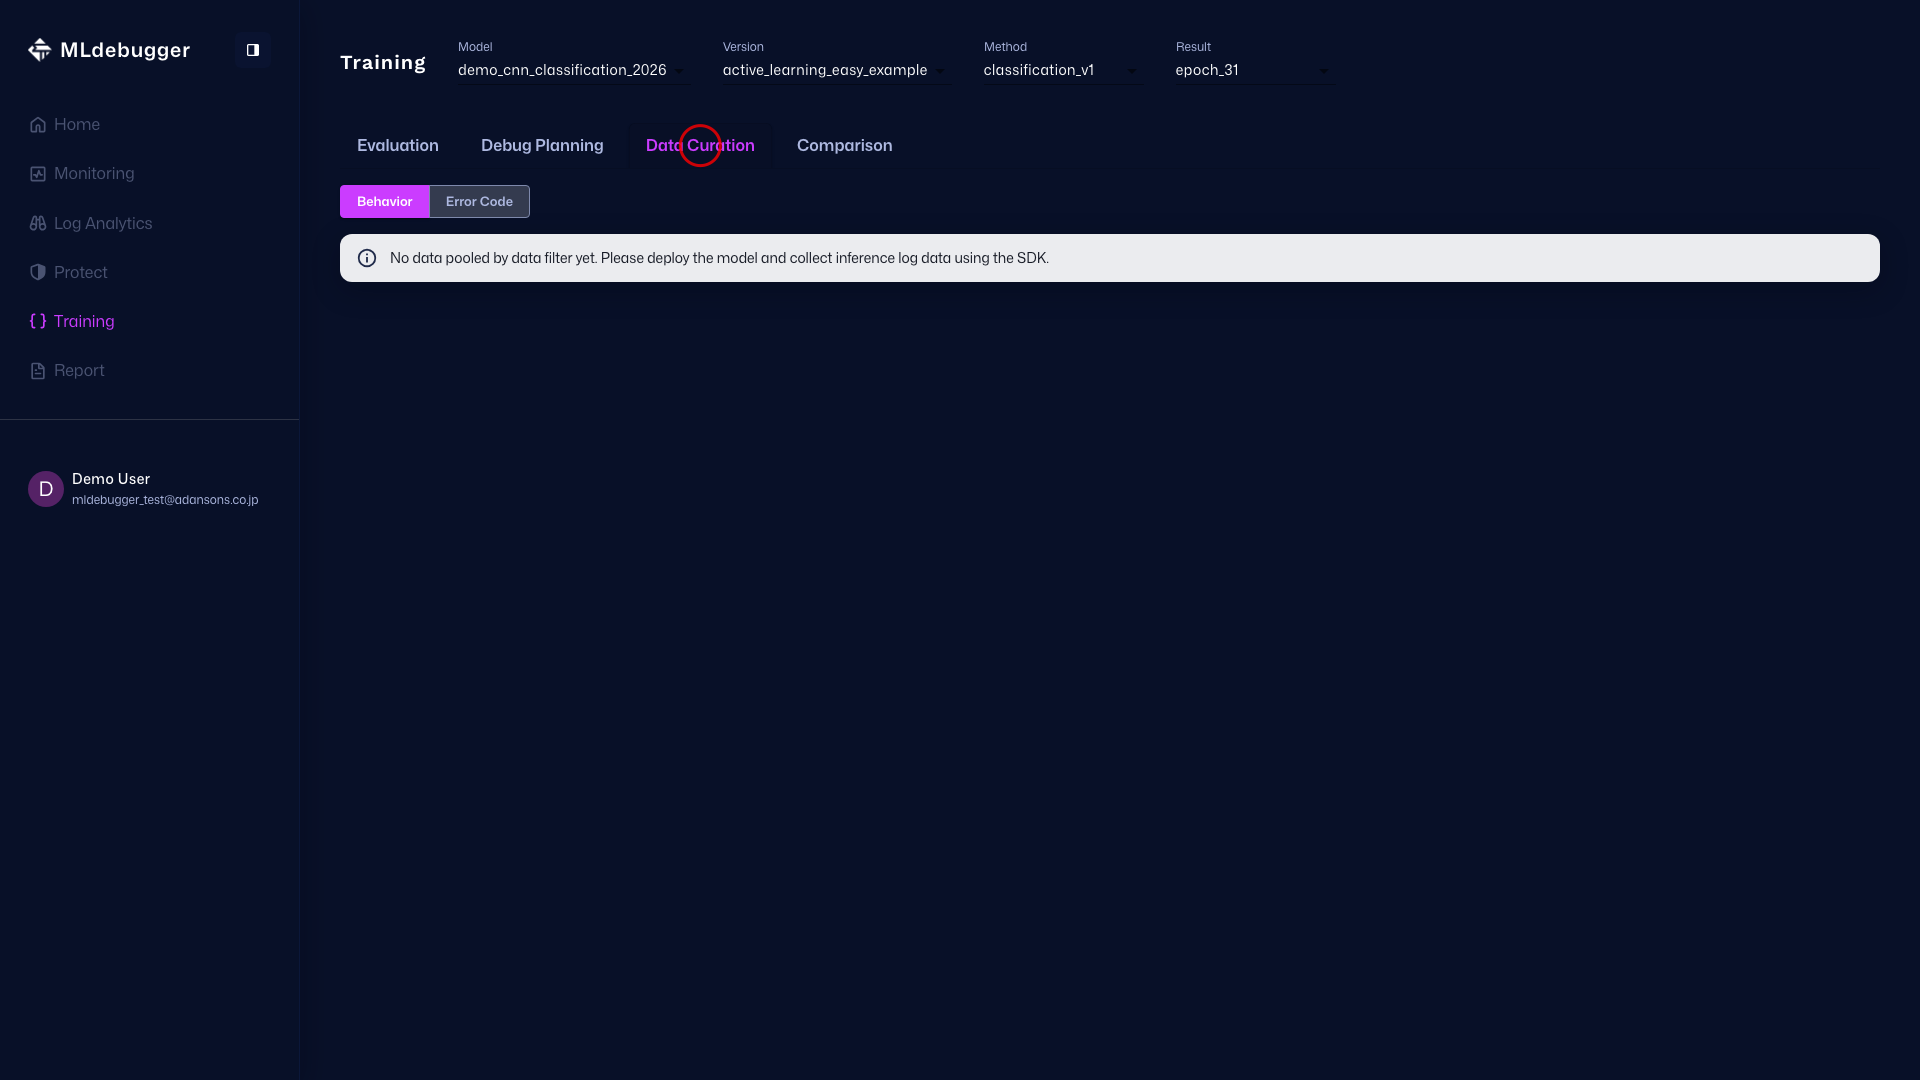
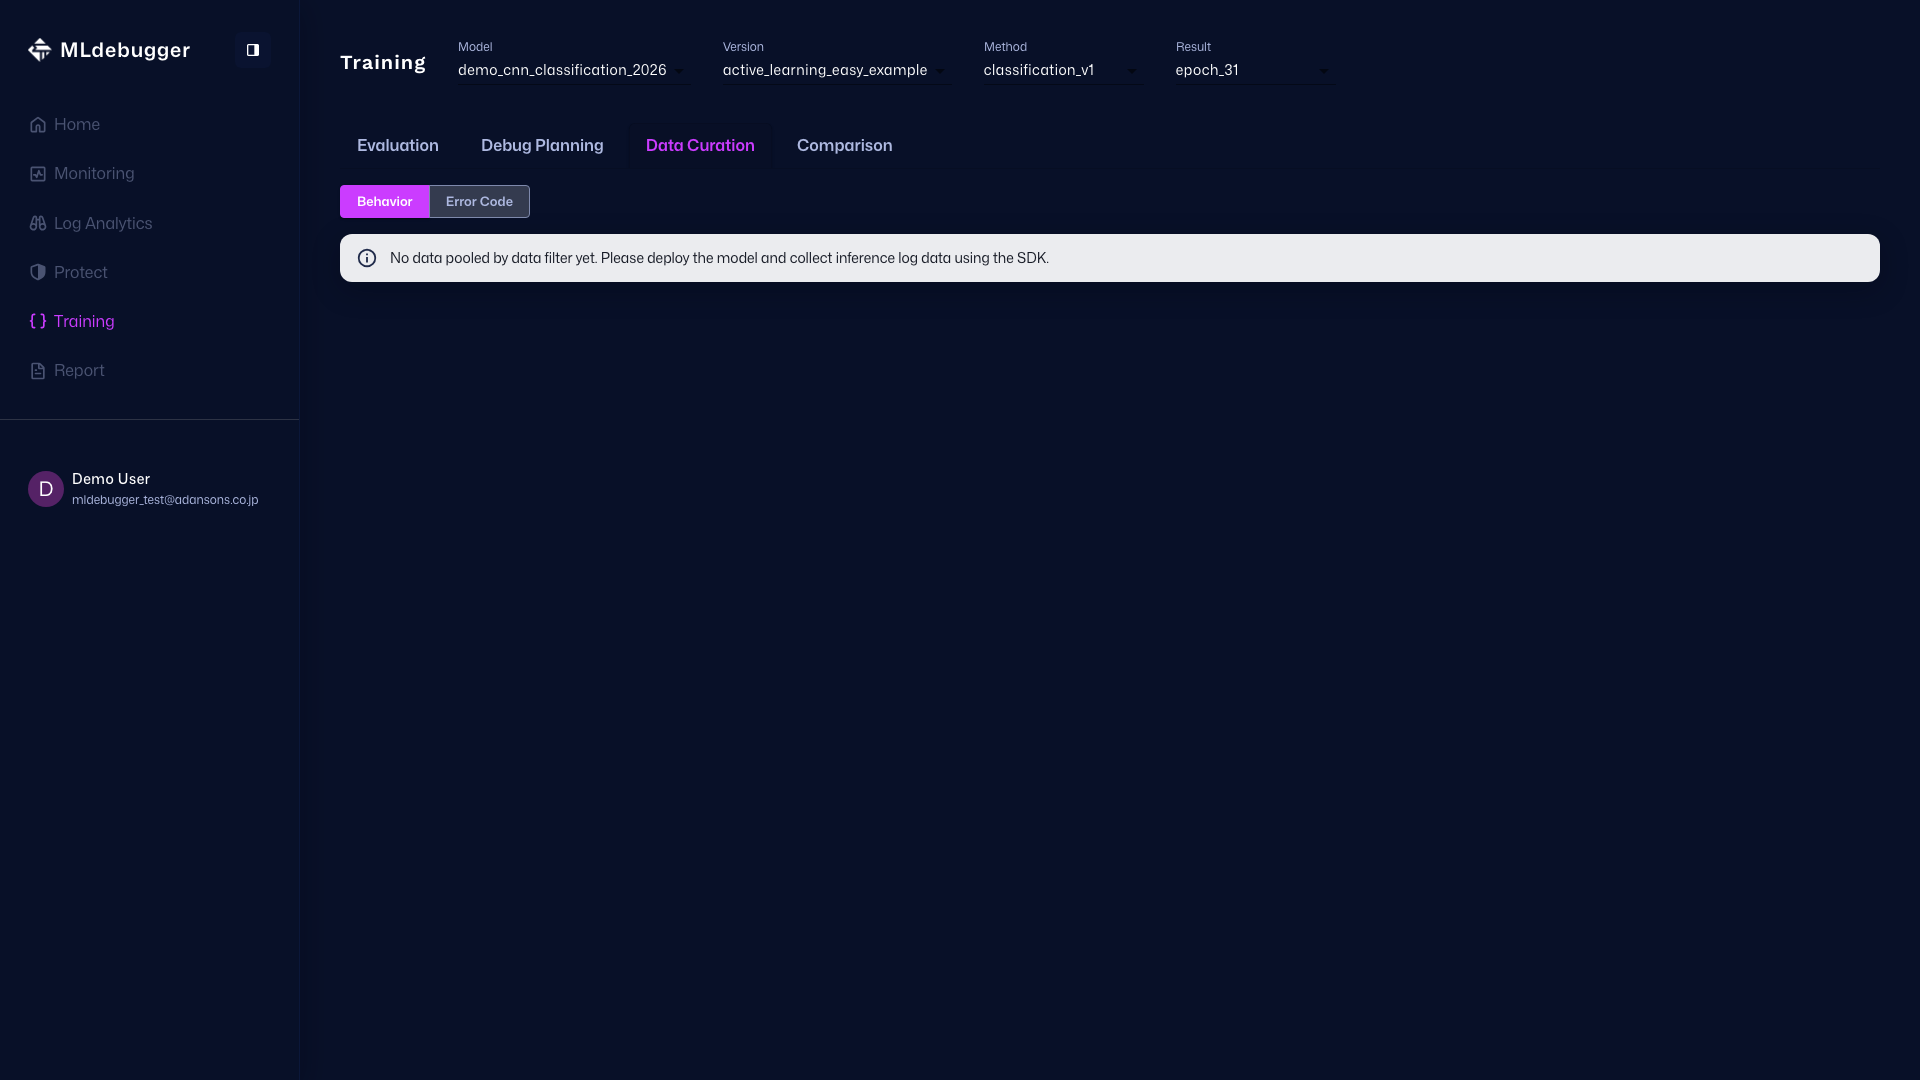
Query Execution Screen
If SDK data has not been ingested, detailed Target Heatmap / Segments operations are not shown. Re-capture this screen after ingesting data through the SDK.
Compare Tab
Tab Purpose
The Compare tab compares other models or epochs and evaluates baseline performance relatively.
Main Check Points
Use the Selected only / ALL switch and add comparison targets to perform both local comparisons and full-trend comparisons.
Operations and Screen Changes
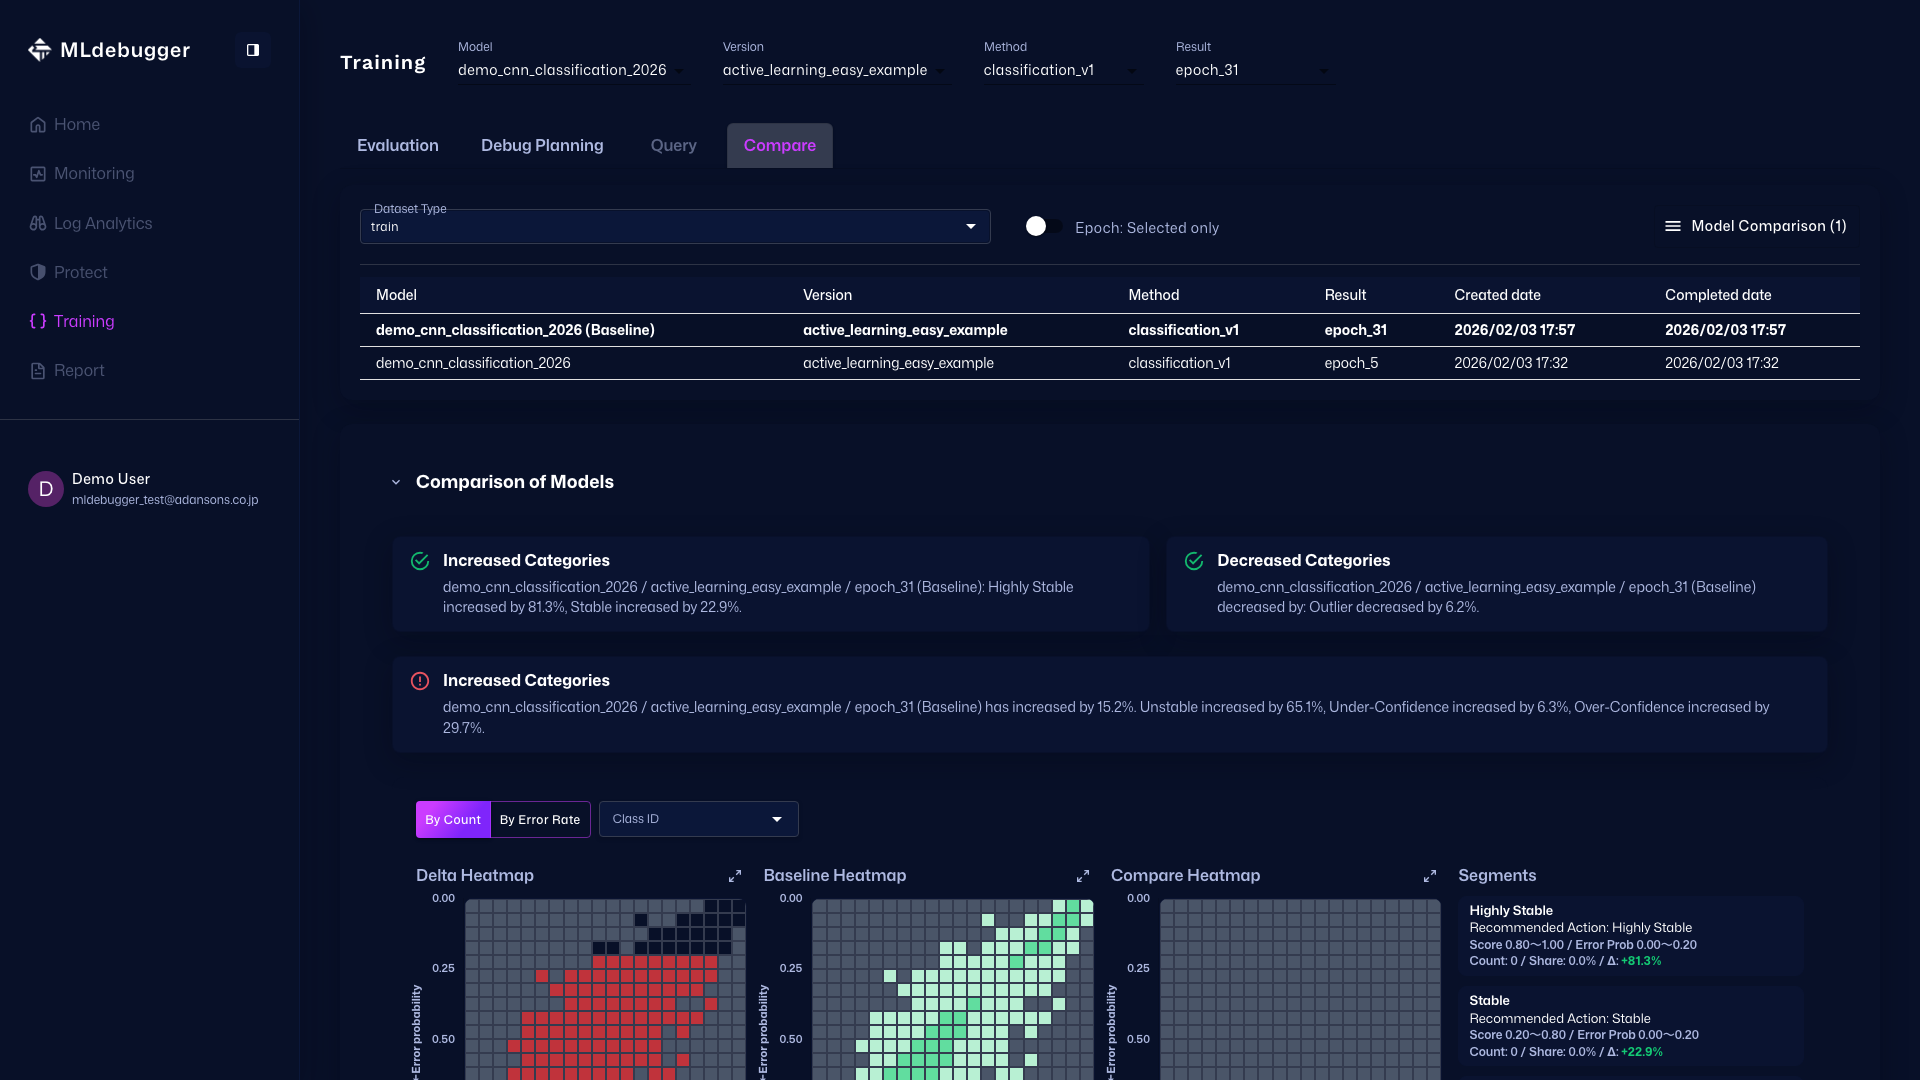
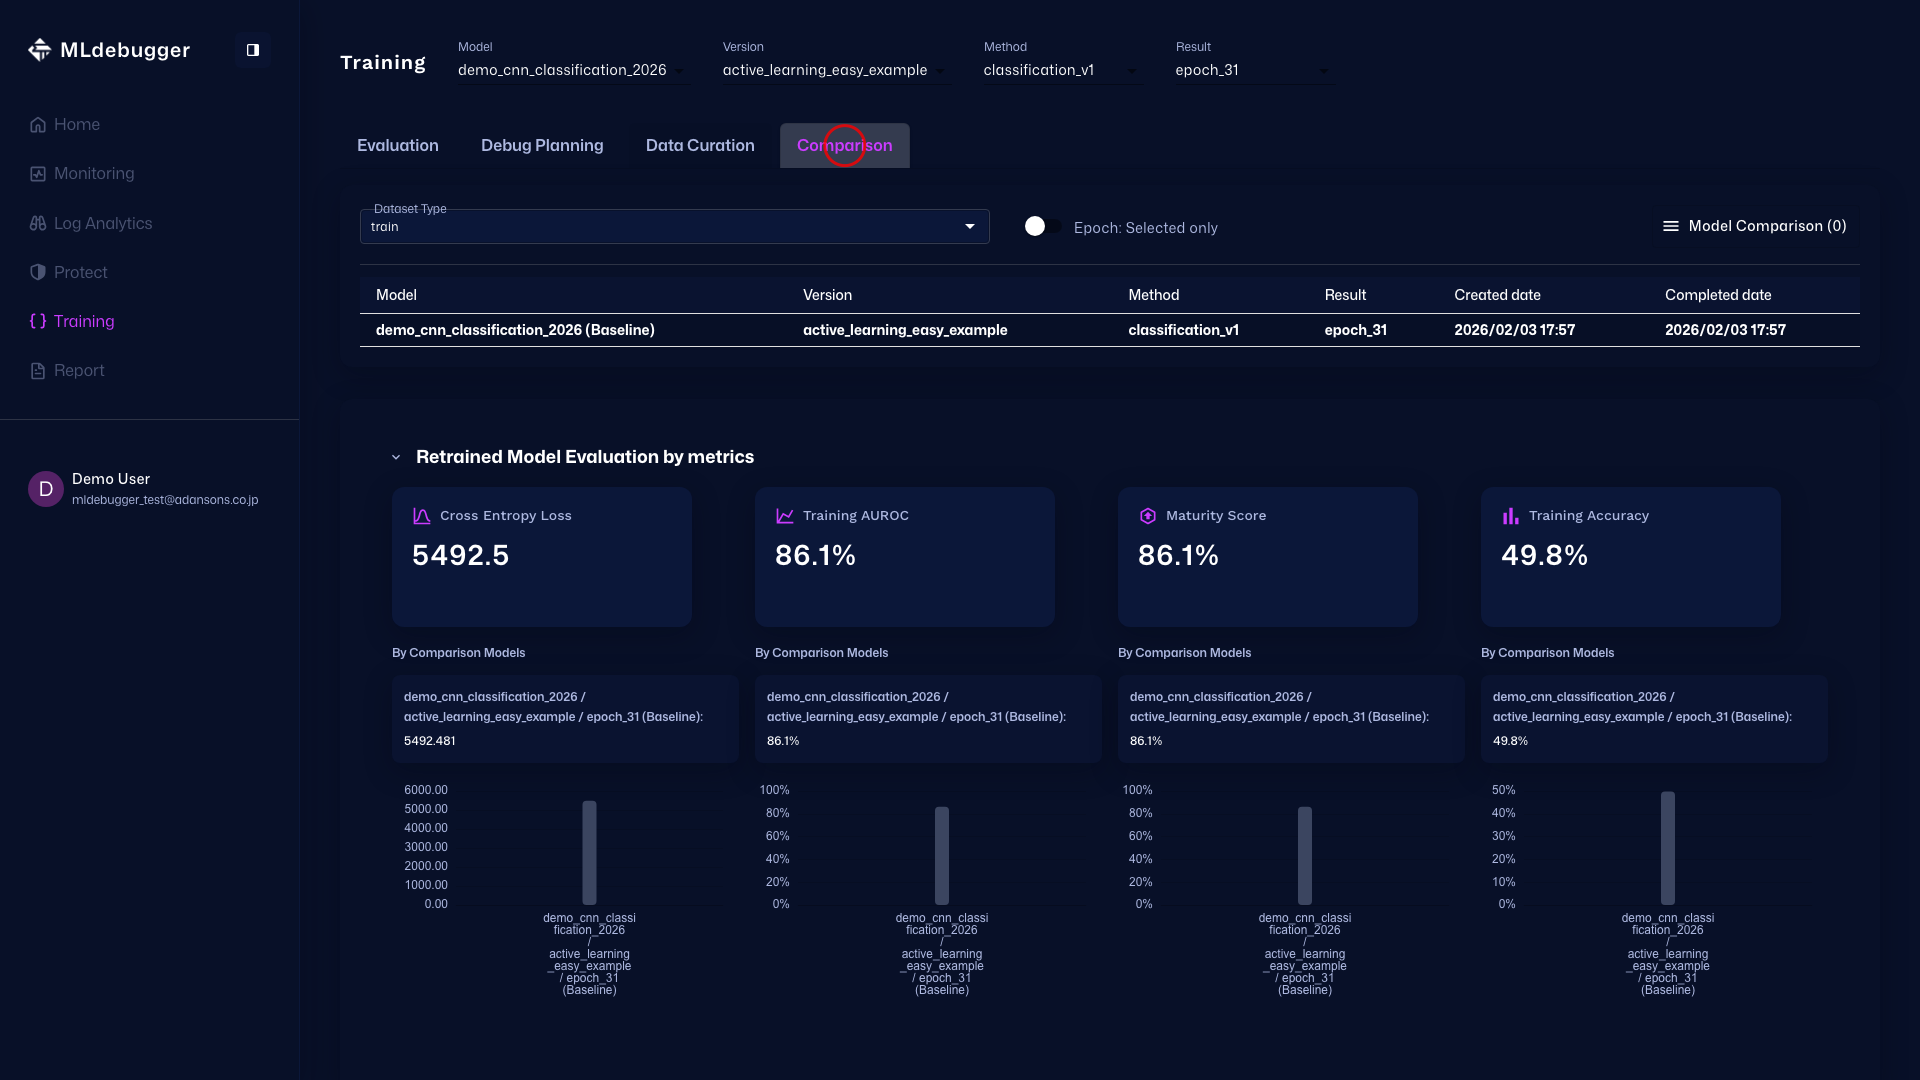
Compare Tab
This screen compares evaluation results. Review differences by placing the baseline result and comparison targets side by side.
In Epoch: Selected only mode, the selected specific epoch is used as the comparison target.
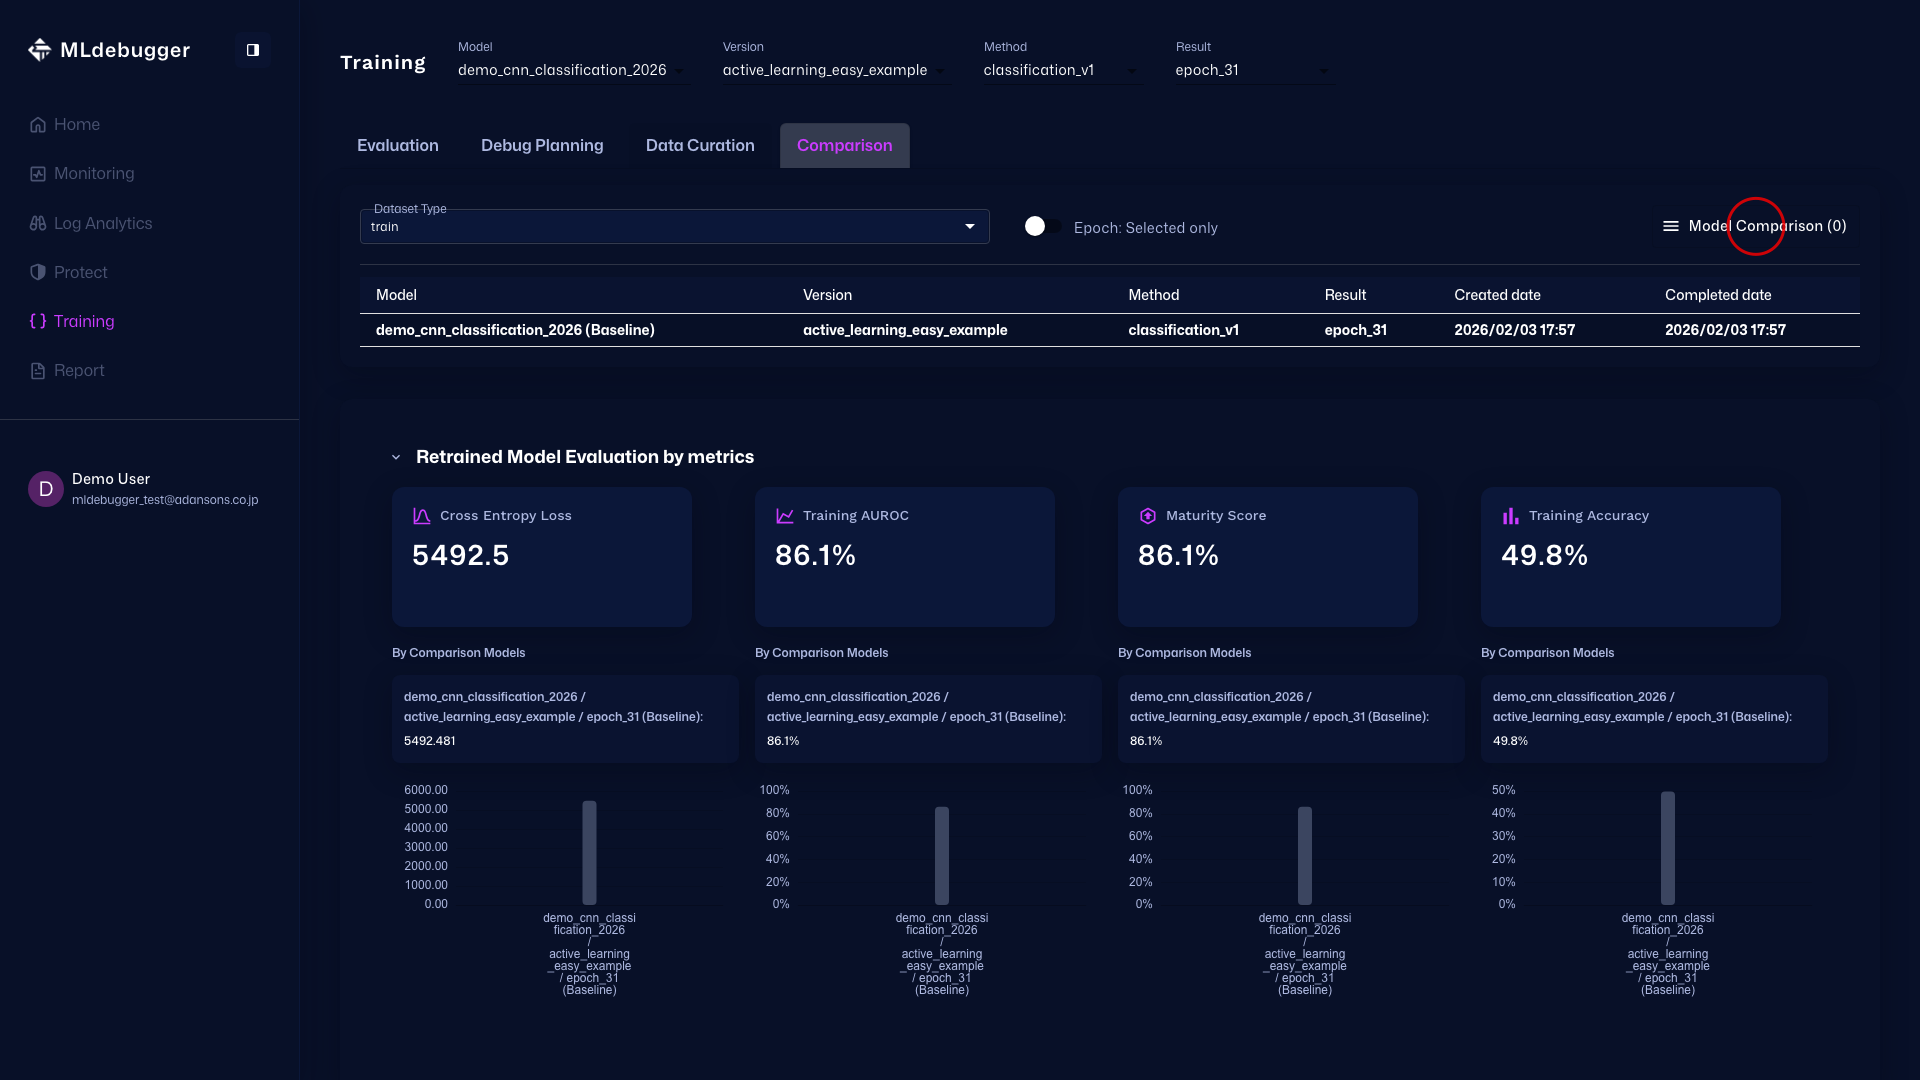
Model Comparison Menu (Before Opening)
Press the Model Comparison hamburger menu (three lines) in the upper right to open the drawer for selecting comparison models.
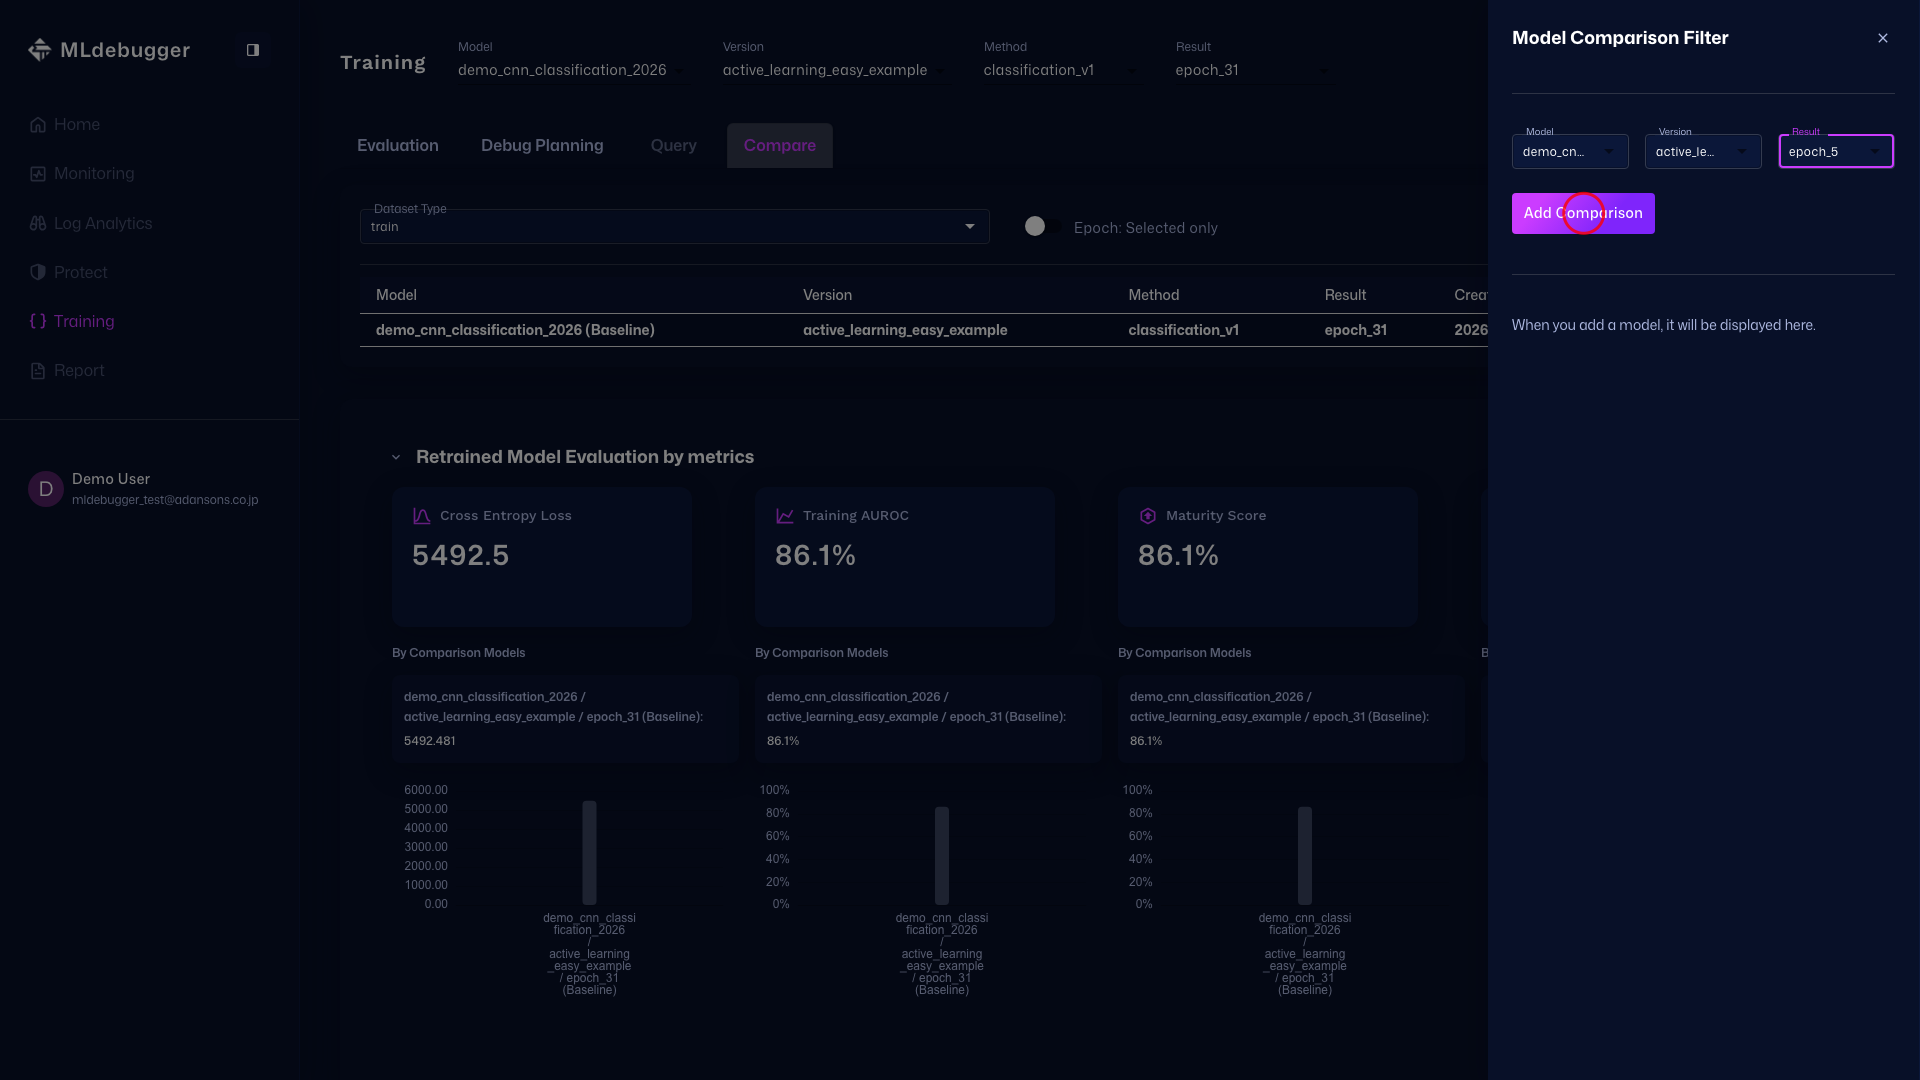
Model Comparison Menu
In this drawer, select the comparison target Model / Version / Result and add it with the Add Model Comparison button.
Comparison of Models
Review the full screen after adding comparison targets. Compare differences between models by looking at the top settings and the heatmap differences together.