Log Analytics
URL: https://app.adansons.ai/log-analytics
Screen Overview
Purpose
This screen analyzes trend changes in GT-less inference by comparing them with GT-available evaluation results.
You can check for data drift or anomalies relative to the state observed during GT-based evaluation.
Key Features
Compare and analyze results by error code and heatmap.
Error Trend Tab
Tab Purpose
The Error Trend tab visualizes the distribution of error codes and helps identify where problems are concentrated.
Main Check Points
Switch aggregation conditions such as duration to understand where errors are concentrated and whether there is any bias.
Operations and Screen Changes
Initial View (Error Trend)
This view visualizes estimated issues (error distribution). Model: resnet18, Version: logging_v1 are selected. You can switch between the Error Trend and Behavior Trend tabs.
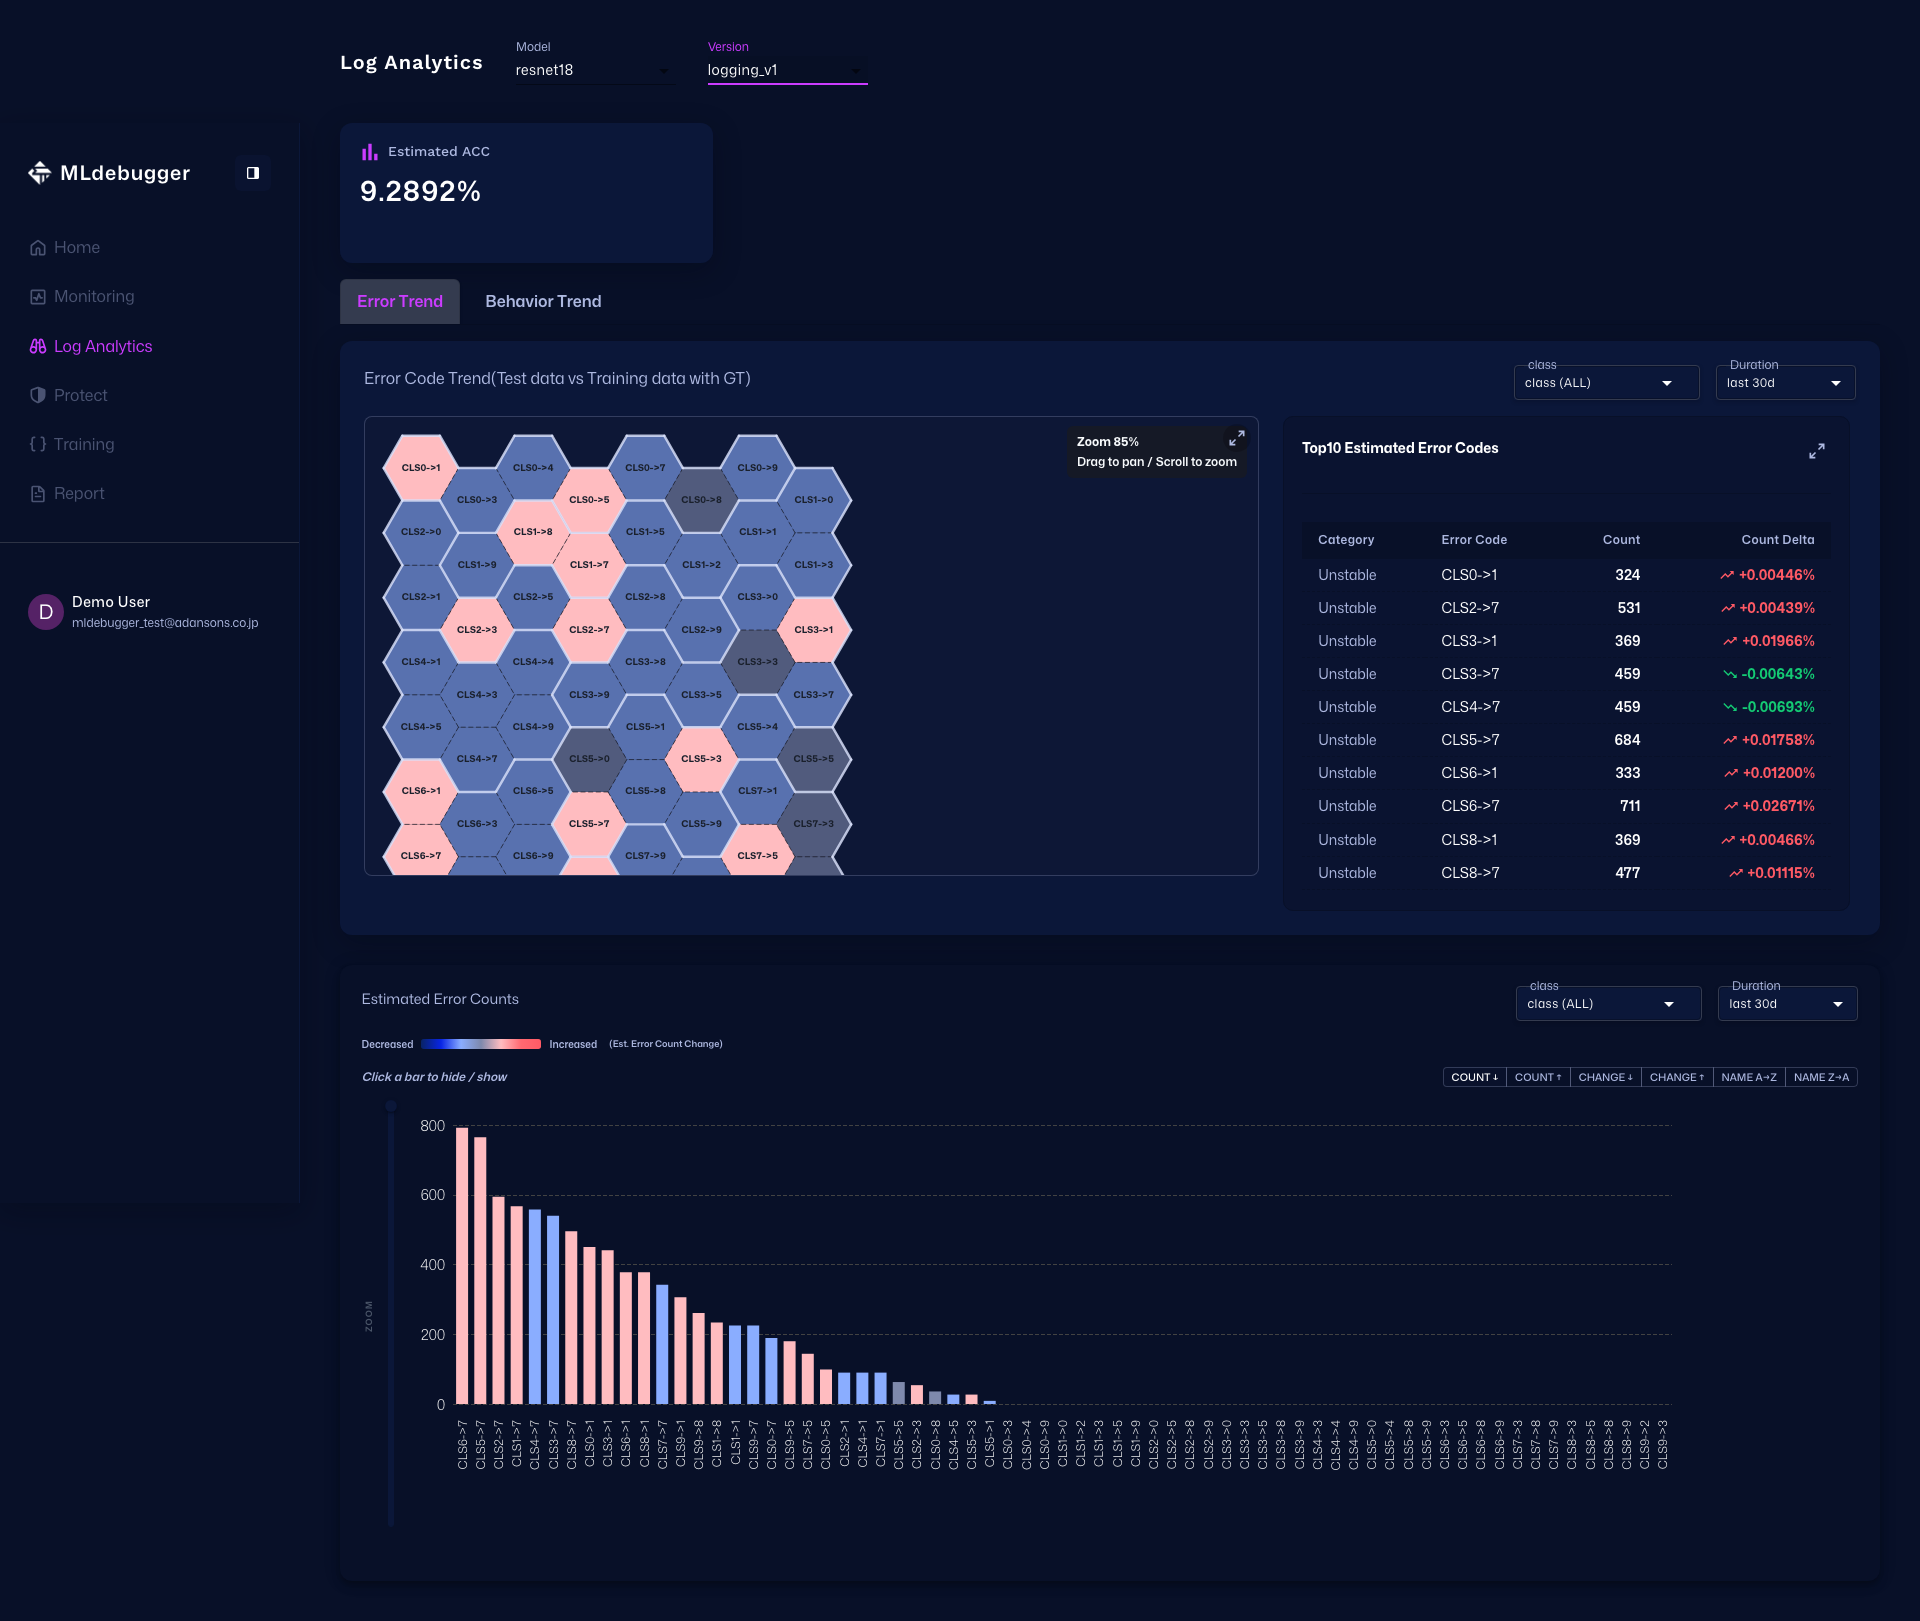
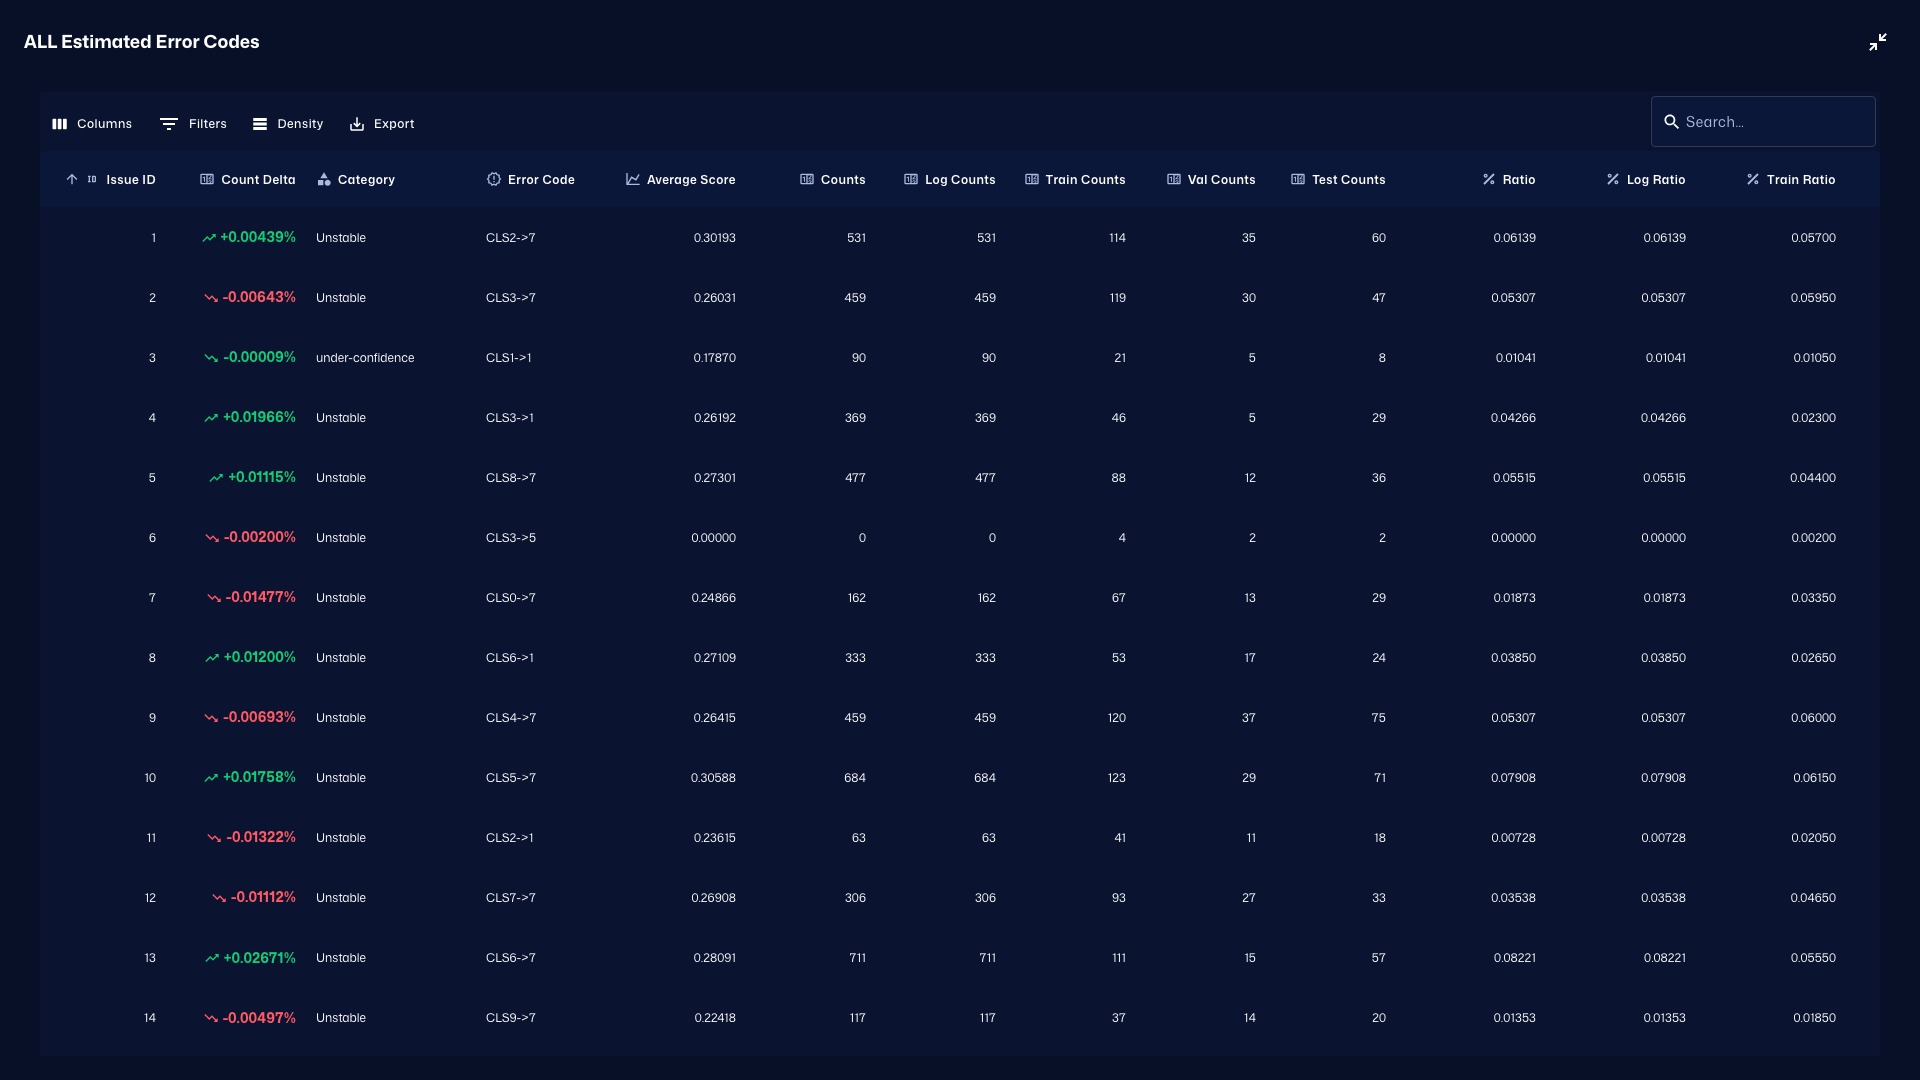
Issue List (Expanded)
When you expand the Issue List, you can inspect detailed counts and breakdowns for each error code. Combined with Error Trend, this helps pinpoint where anomalies are concentrated.
Behavior Trend Tab
Tab Purpose
The Behavior Trend tab lets you switch between the Count and Error Rate modes and compare Diff / Realtime Log / Baseline (calibrated) within each mode.
Main Check Points
Within each mode, check difference values and distributions together by comparing Diff, Realtime Log, and Baseline side by side.
Operations and Screen Changes
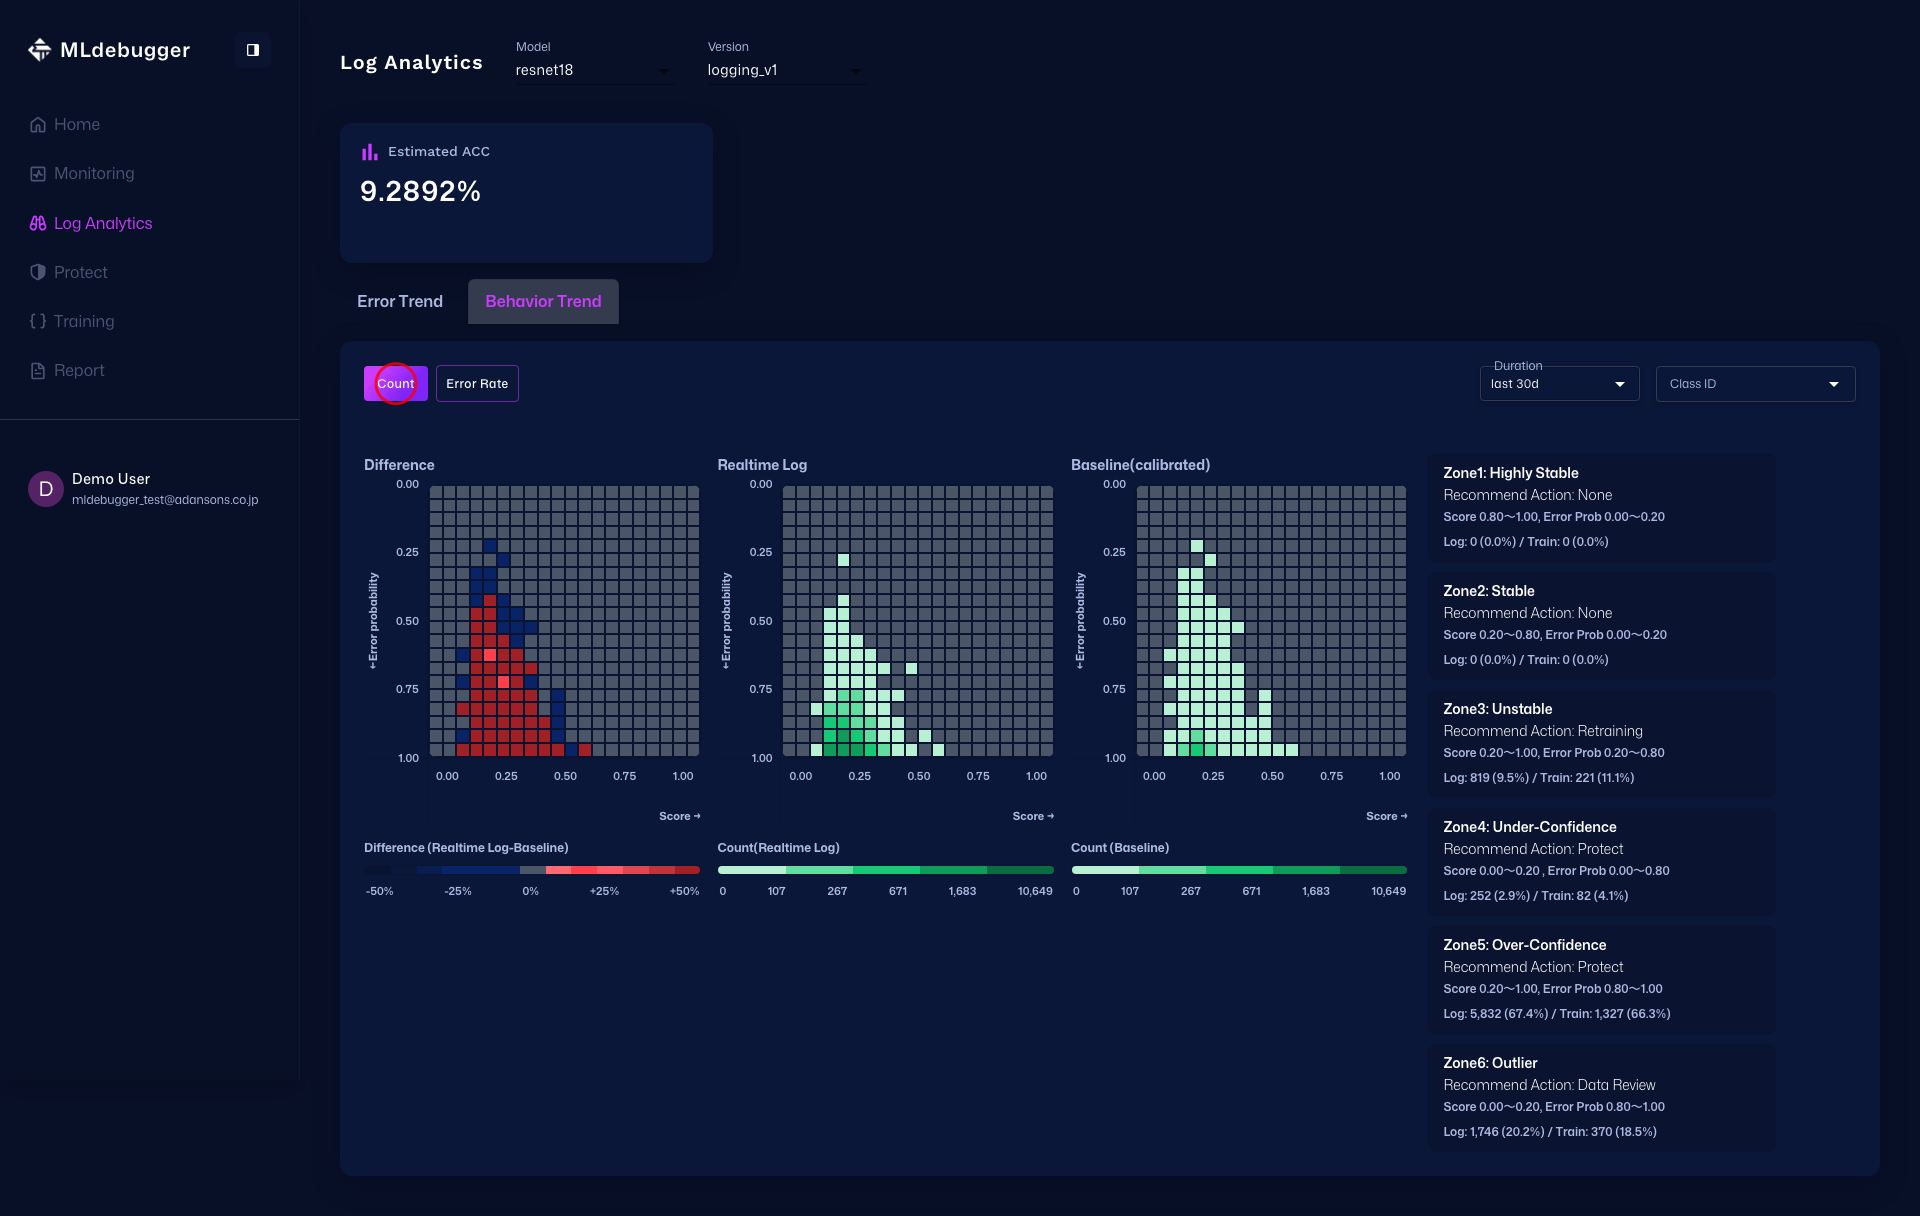
Count (Initial)
Count mode is shown initially. Three heatmaps, Diff / Realtime Log / Baseline (calibrated), are displayed side by side so you can inspect both count differences and count distributions together.

Count
In Count mode, the three heatmaps Diff / Realtime Log / Baseline (calibrated) let you compare per-cell count differences and count distributions.
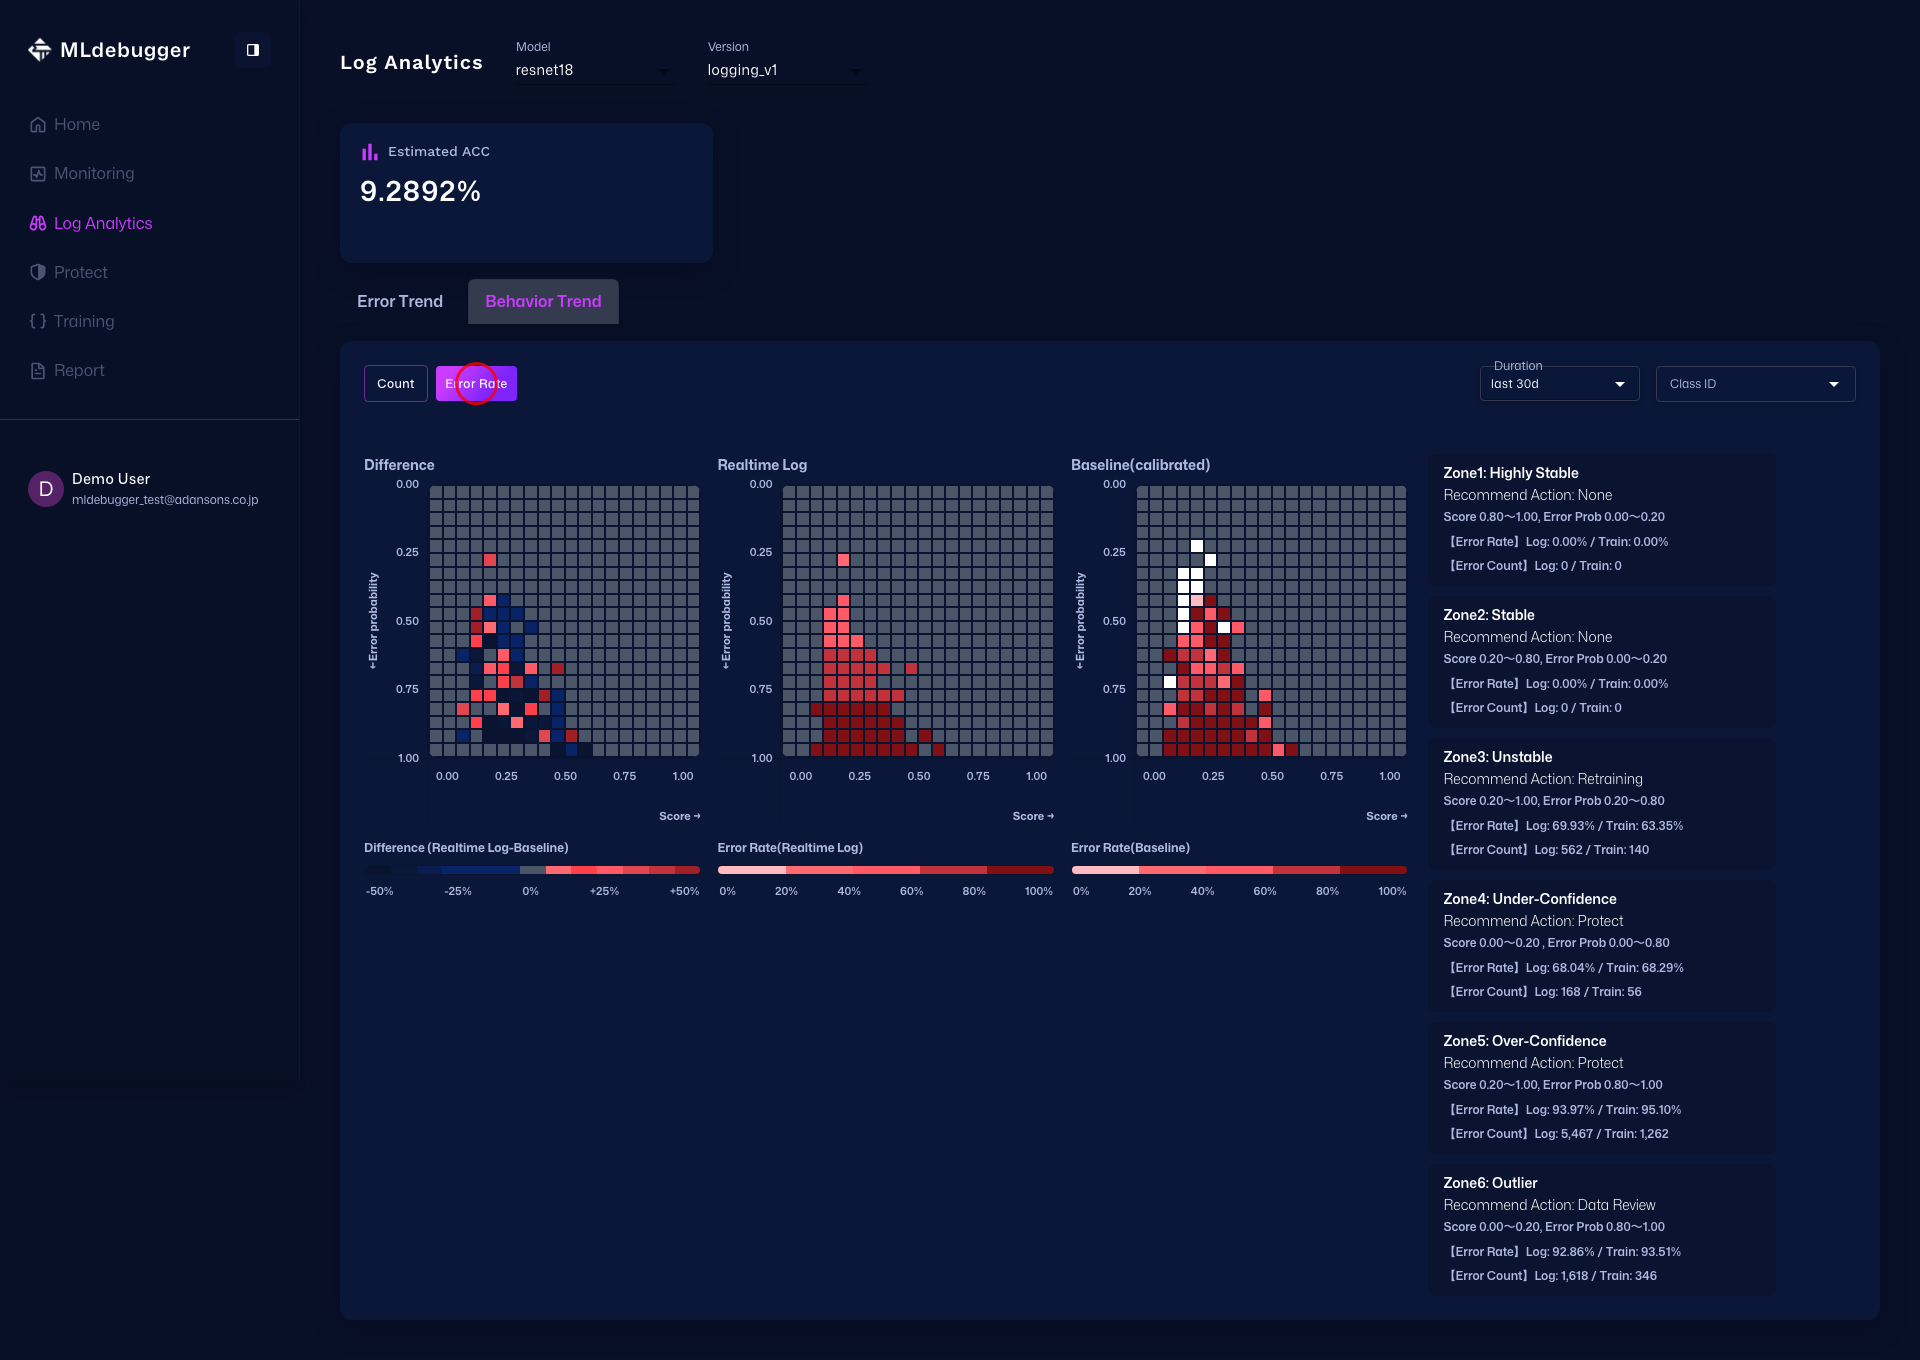
Error Rate
In Error Rate mode, the three heatmaps Diff / Realtime Log / Baseline (calibrated) let you compare differences and distributions of the error ratio relative to the entire heatmap. Diff represents Realtime Log minus Baseline.